Climate change may seem like a new or emerging field, but scientists have been studying the topic for more than 160 years. Below are five significant moments from this important discipline.
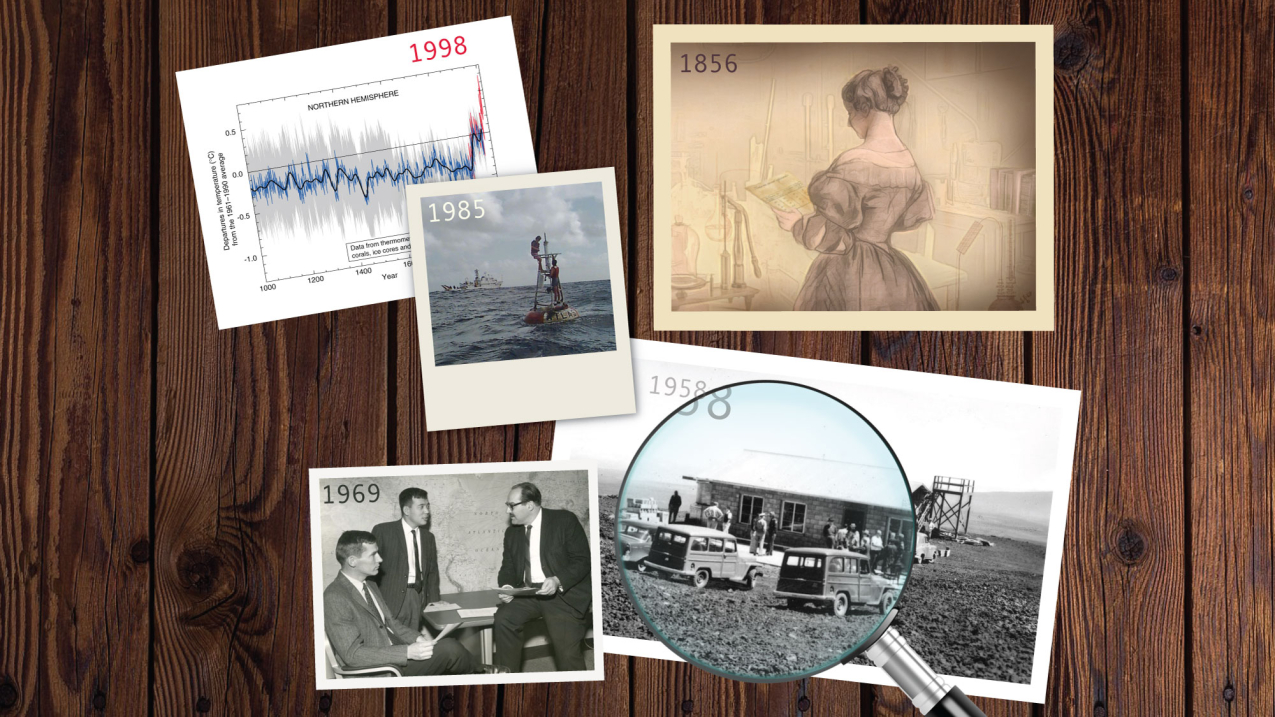
Images from five moments in climate history. (Image credit: NOAA Heritage/Climate.gov)
Although not included on the list, the formation of the National Oceanic and Atmospheric Administration within the U.S. Department of Commerce in 1970 signified a national dedication to science, stewardship and service that very much included climate. NOAA remains at the forefront, leading the way in gathering the observations of the ocean and atmosphere that help to keep track of how the world’s natural systems have evolved and changed through time.

1856
Amateur scientist Eunice Newton Foote argues, via a male colleague at the Annual Meeting of the American Association for the Advancement of Science (AAAS), that increased carbon dioxide could impact the climate in what we now call the Greenhouse Effect, demonstrating that the sun’s warming effect would be greater for air with water vapor and even greater with carbon dioxide.
Foote was building on arguments made by others in the 1820s and 1830s.
In 1859, three years after Foote’s paper was put forth, John Tyndall completed several sophisticated experiments that offsite linkvalidated the same basic theory, and is remembered as the “father of the greenhouse gas effect.” Foote’s work, in contrast, was overlooked entirely until 2010, when a retired petroleum geologist discovered descriptions of her paper in some pre-Civil War technical journals.
It is unclear if Tyndall was aware of Foote’s research and writings. Women were unwelcome at most scientific meetings in the nineteenth century, and their work was often dismissed based on sexist assumptions about female intellect. The same year her paper was published, a column writer in Scientific American praised her AAAS paper as evidence that women had the ability to “investigate any subject with originality and precision.”
1958
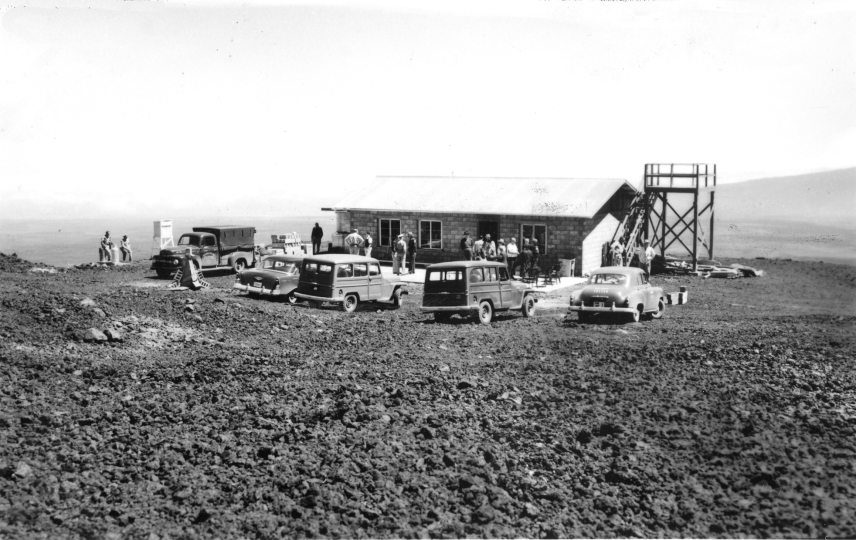
Charles David Keeling begins taking measurements carbon dioxide offsite link concentrations near the top of Hawaii’s Mauna Loa volcano at a facility owned by NOAA.
Over time Keeling, who became a researcher with the Scripps Institution of Oceanography UC San Diego, discovered that plants take in CO2 during the summer months, which reduces atmospheric CO2. In the winter when plants lose their foliage, carbon that had been stored within their tissue is released to the atmosphere, thereby increasing CO2 concentrations.
He also was able to graph and document a rise in atmospheric CO2 over the course of many years, demonstrating the impact of the burning of fossil fuels and land use changes upon the planet.
The graph constitutes the longest record of direct measurements of CO2 in the atmosphere. NOAA started its own CO2 measurements in May of 1974, and they have run in parallel with those made by the Scripps Institution ever since.
1969
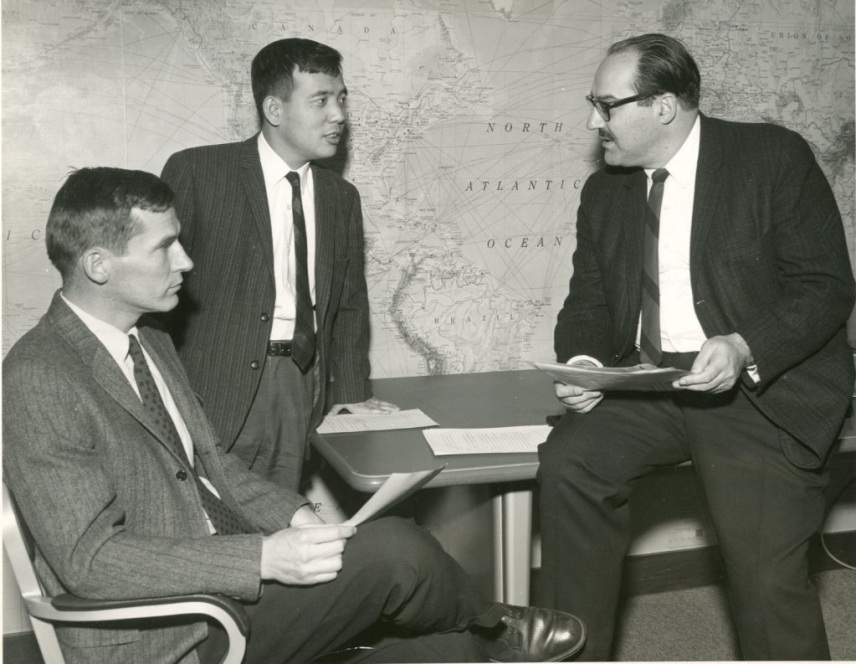
NOAA scientists Joseph Smagorinsky, Syukuro Manabe and Kirk Bryan publish the results of the first coupled ocean–atmosphere general circulation model.
Their model would build the foundation for later climate simulations which in turn became a powerful tool for global warming research. Manabe and Bryan’s work, conducted at NOAA’s Geophysical Fluid Dynamics Laboratory, also predicted how changes in the natural factors that control climate such as ocean and atmospheric currents and temperature could lead to climate change. Earlier knowledge of the oceanic and atmospheric circulation and their interactions were based purely on theory and observation.
Not many outside of computing are aware of their achievements, but in 2006, the journal Nature cited GFDL’s original climate model among other breakthroughs offsite link in their list of milestones in scientific computing which have had a profound effect on society, along with innovations such as the first CT scanner, the first hand-held scientific calculator, and the Internet.
Manabe won a Nobel Prize for his work on climate models in 2021.
1985
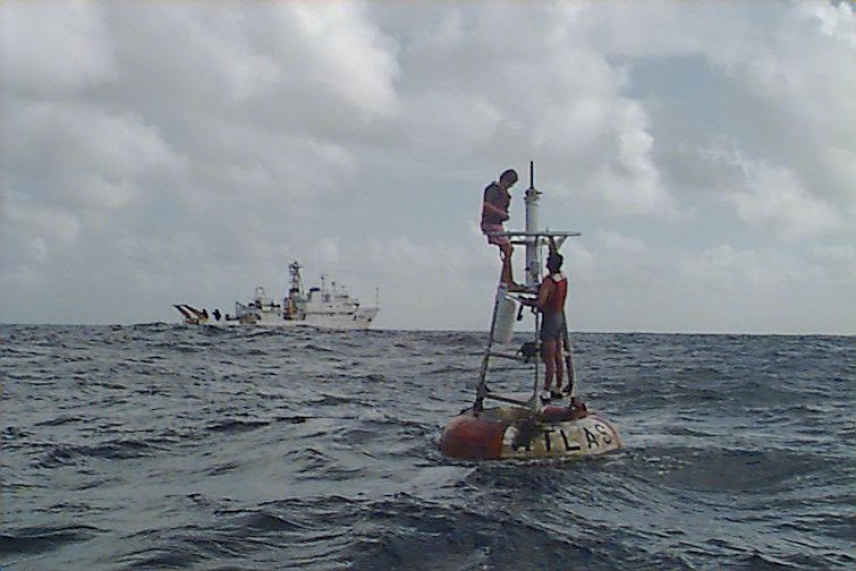
NOAA’s Tropical Ocean Global Atmosphere program (TOGA) deploys a series of buoys across the Pacific Ocean meant to help scientists better predict tropical phenomena (like ENSO), and improve climate predictions.
The Tropical Atmosphere Ocean (TAO) buoy array was put in place after the 1982-83 El Niño—one of the three strongest on record back to 1950.
The buoy network, which now includes 70 ocean moorings and is maintained by the National Buoy Data Center, were anchored to the sea floor across the equatorial Pacific Ocean. They measure atmospheric conditions like wind speed and direction, relative humidity, and air temperature. In the water, they measure ocean temperatures at the sea surface and 10 other depths in the upper 500 meters. At four specific moorings, they also measure horizontal and/or vertical currents, as well as radiation from the sun and earth, rain, and barometric pressure.
The observations gained through the TAO array have revolutionized our understanding of the El Nino - Southern Oscillation (ENSO) by providing insights into how heat is transferred between the western and eastern sides of the ocean basin.
![Chart showing time reconstructions [blue] and instrumental data [red] for Northern Hemisphere mean temperature (NH). In both cases, the zero line corresponds to the 1902-80 calibration mean of the quantity. Raw data are shown up to 1995 and positive and negative 2-sigma uncertainty limits are shown by the gray shaded region. The thick black line corresponds to a lowpass filtered version of the reconstruction. (Image credit: IPCC) Chart showing time reconstructions [blue] and instrumental data [red] for Northern Hemisphere mean temperature (NH). In both cases, the zero line corresponds to the 1902-80 calibration mean of the quantity. Raw data are shown up to 1995 and positive and negative 2-sigma uncertainty limits are shown by the gray shaded region. The thick black line corresponds to a lowpass filtered version of the reconstruction.](/sites/default/files/styles/default_width_856/public/2024-01/IPCC_2001_3rd_Assessment_Report_SPM.png?h=43f30641&itok=W8y1UcX9)
1998
Michael Mann from the University of Massachusetts publishes a paper reconstructing global temperatures over the past 1,000 years. The shape of the paper’s main graph is compared to a hockey stick, with temperature ranges remaining relatively constant but rising dramatically around 1900.
At the time of the initial paper’s release, the methodology of the “hockey stick” paper may have seemed novel to some. Mann and his fellow authors could not use historical records for the time periods before scientific instruments were developed to measure temperatures. Instead, they vetted more than 500 proxy records from the world’s oceans, including fossilized remains of plankton and microbes in sediment. They were then able to use statistical methods to determine the sea surface temperatures by using those proxy records and cross-checking them against ice core samples from the North and South poles, among other things. Proxy records were not new, but synthesizing them in one large study was still new at the time.
The research, which was published in Nature offsite link, was referenced in a 2001 UN climate report offsite link, which stated offsite link that “new analyses of proxy data for the Northern Hemisphere indicate that the increase in temperature in the 20th century is likely to have been the largest of any century during the past 1,000 years.”
As we move into the future, climate research will no doubt continue to grow and continue to expand our understanding of the earth’s changing atmosphere and ocean, and the impacts of climate change on the ecosystems all around us. In the fall of 2023, NOAA made significant contributions to the creation of the Fifth National Climate Assessment which was released by the U.S. Global Change Research Program on November 14, 2023. NOAA will continue to play a central role in climate work.


