Across America, NOAA’s footprint is deep and profound. NOAA touches the lives of all Americans and affects nearly every sector of our economy. In fulfilling this vast mission, NOAA creates enormous economic value.
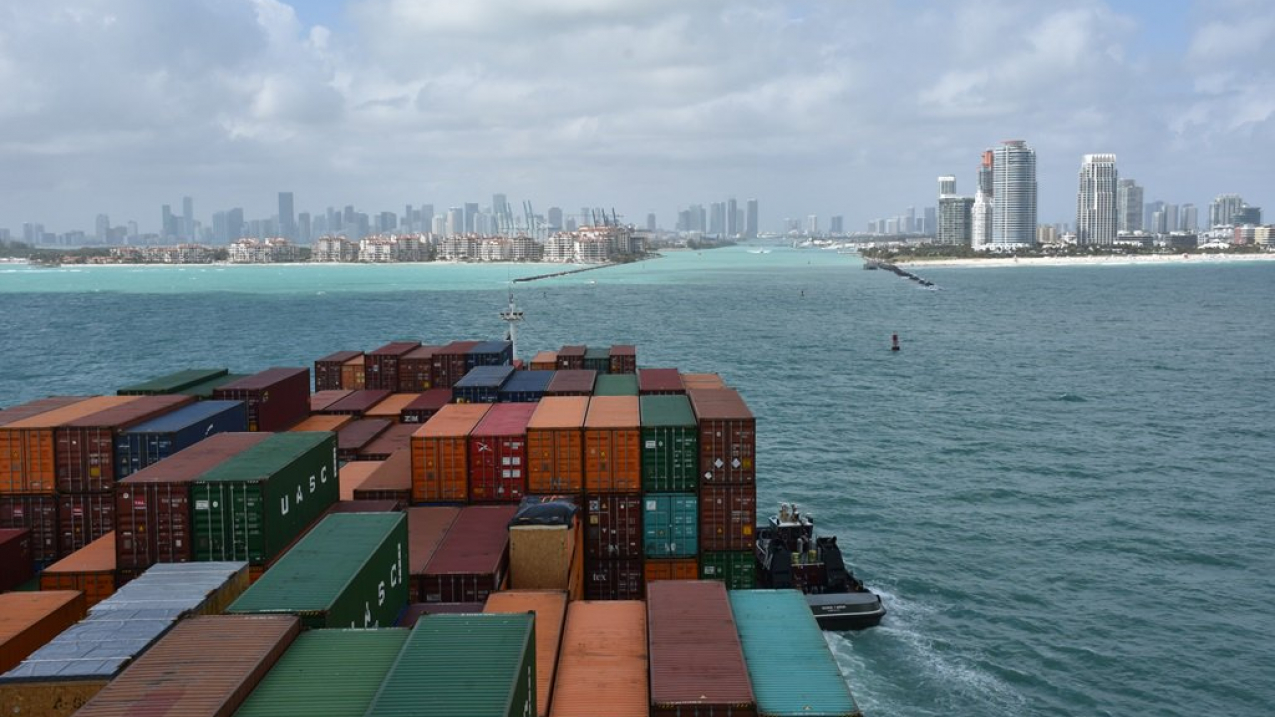
Cargo ship safely entering the port of Miami in Florida. (Image credit: NOAA)
Across America, NOAA’s footprint is deep and profound.
NOAA touches the lives of all Americans and affects nearly every sector of our economy.
In fulfilling this vast mission, NOAA creates enormous economic value.
A nationwide survey shows the public obtains 300 billion weather forecasts per year, generating $31.5 billion in household benefits ($41 billion in 2016), as compared to the $5.1 billion invested publicly and privately to achieve these benefits. (1)
NOAA creates economic value in two ways: Operations and Research
NOAA’s OPERATIONAL value is immense, providing the forecasts, products and services integral to operating U.S. seaports, which support $4.6 trillion in economic activity (2) and open domestic and overseas markets to trade.
Operations ensure life-saving disaster response and the long-term sustainability of America’s $200 billion fisheries (3).
NOAA operations are critical to anticipating tomorrow’s electricity needs, assessing coastal vulnerabilities, and enabling key U.S. industries to operate more efficiently.
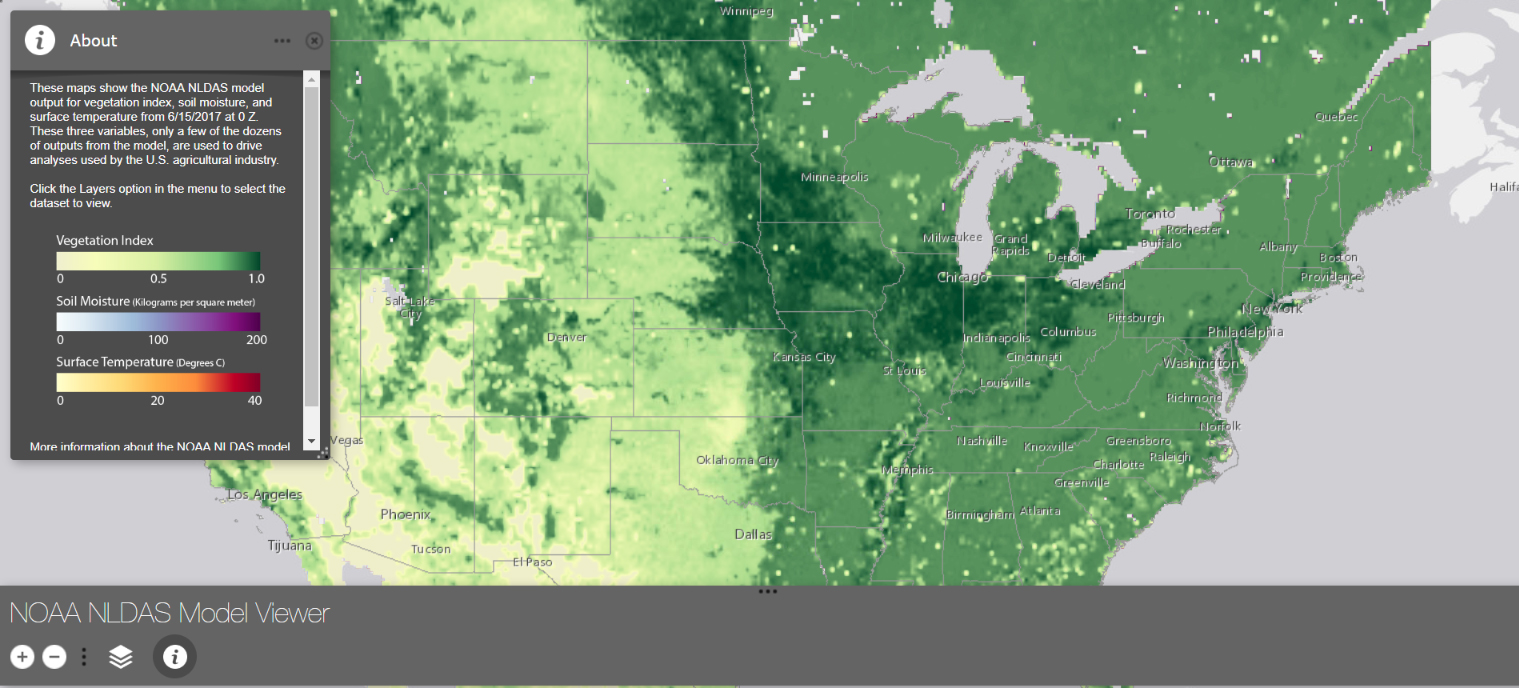
As a world leader in weather, climate and oceanographic RESEARCH, NOAA collects data and develops models that, over time, are transitioned into operations and used to produce vital products and services.
For example, the success of the $137 billion (2015 estimate) agriculture sector depends on accurate environmental forecasts. (4)
Critical decisions about planting, irrigation and harvesting rely on NOAA forecasts, driven by models such as the one shown here. This model is fed by precipitation, humidity, soil moisture and other data generated by gauges that measure rainfall.
Imagery: Click the layered icon (bottom, left) to see land features used to drive agricultural analyses. Click the "i" icon for more details.
Following is a snapshot of NOAA’s value to the U.S. economy:
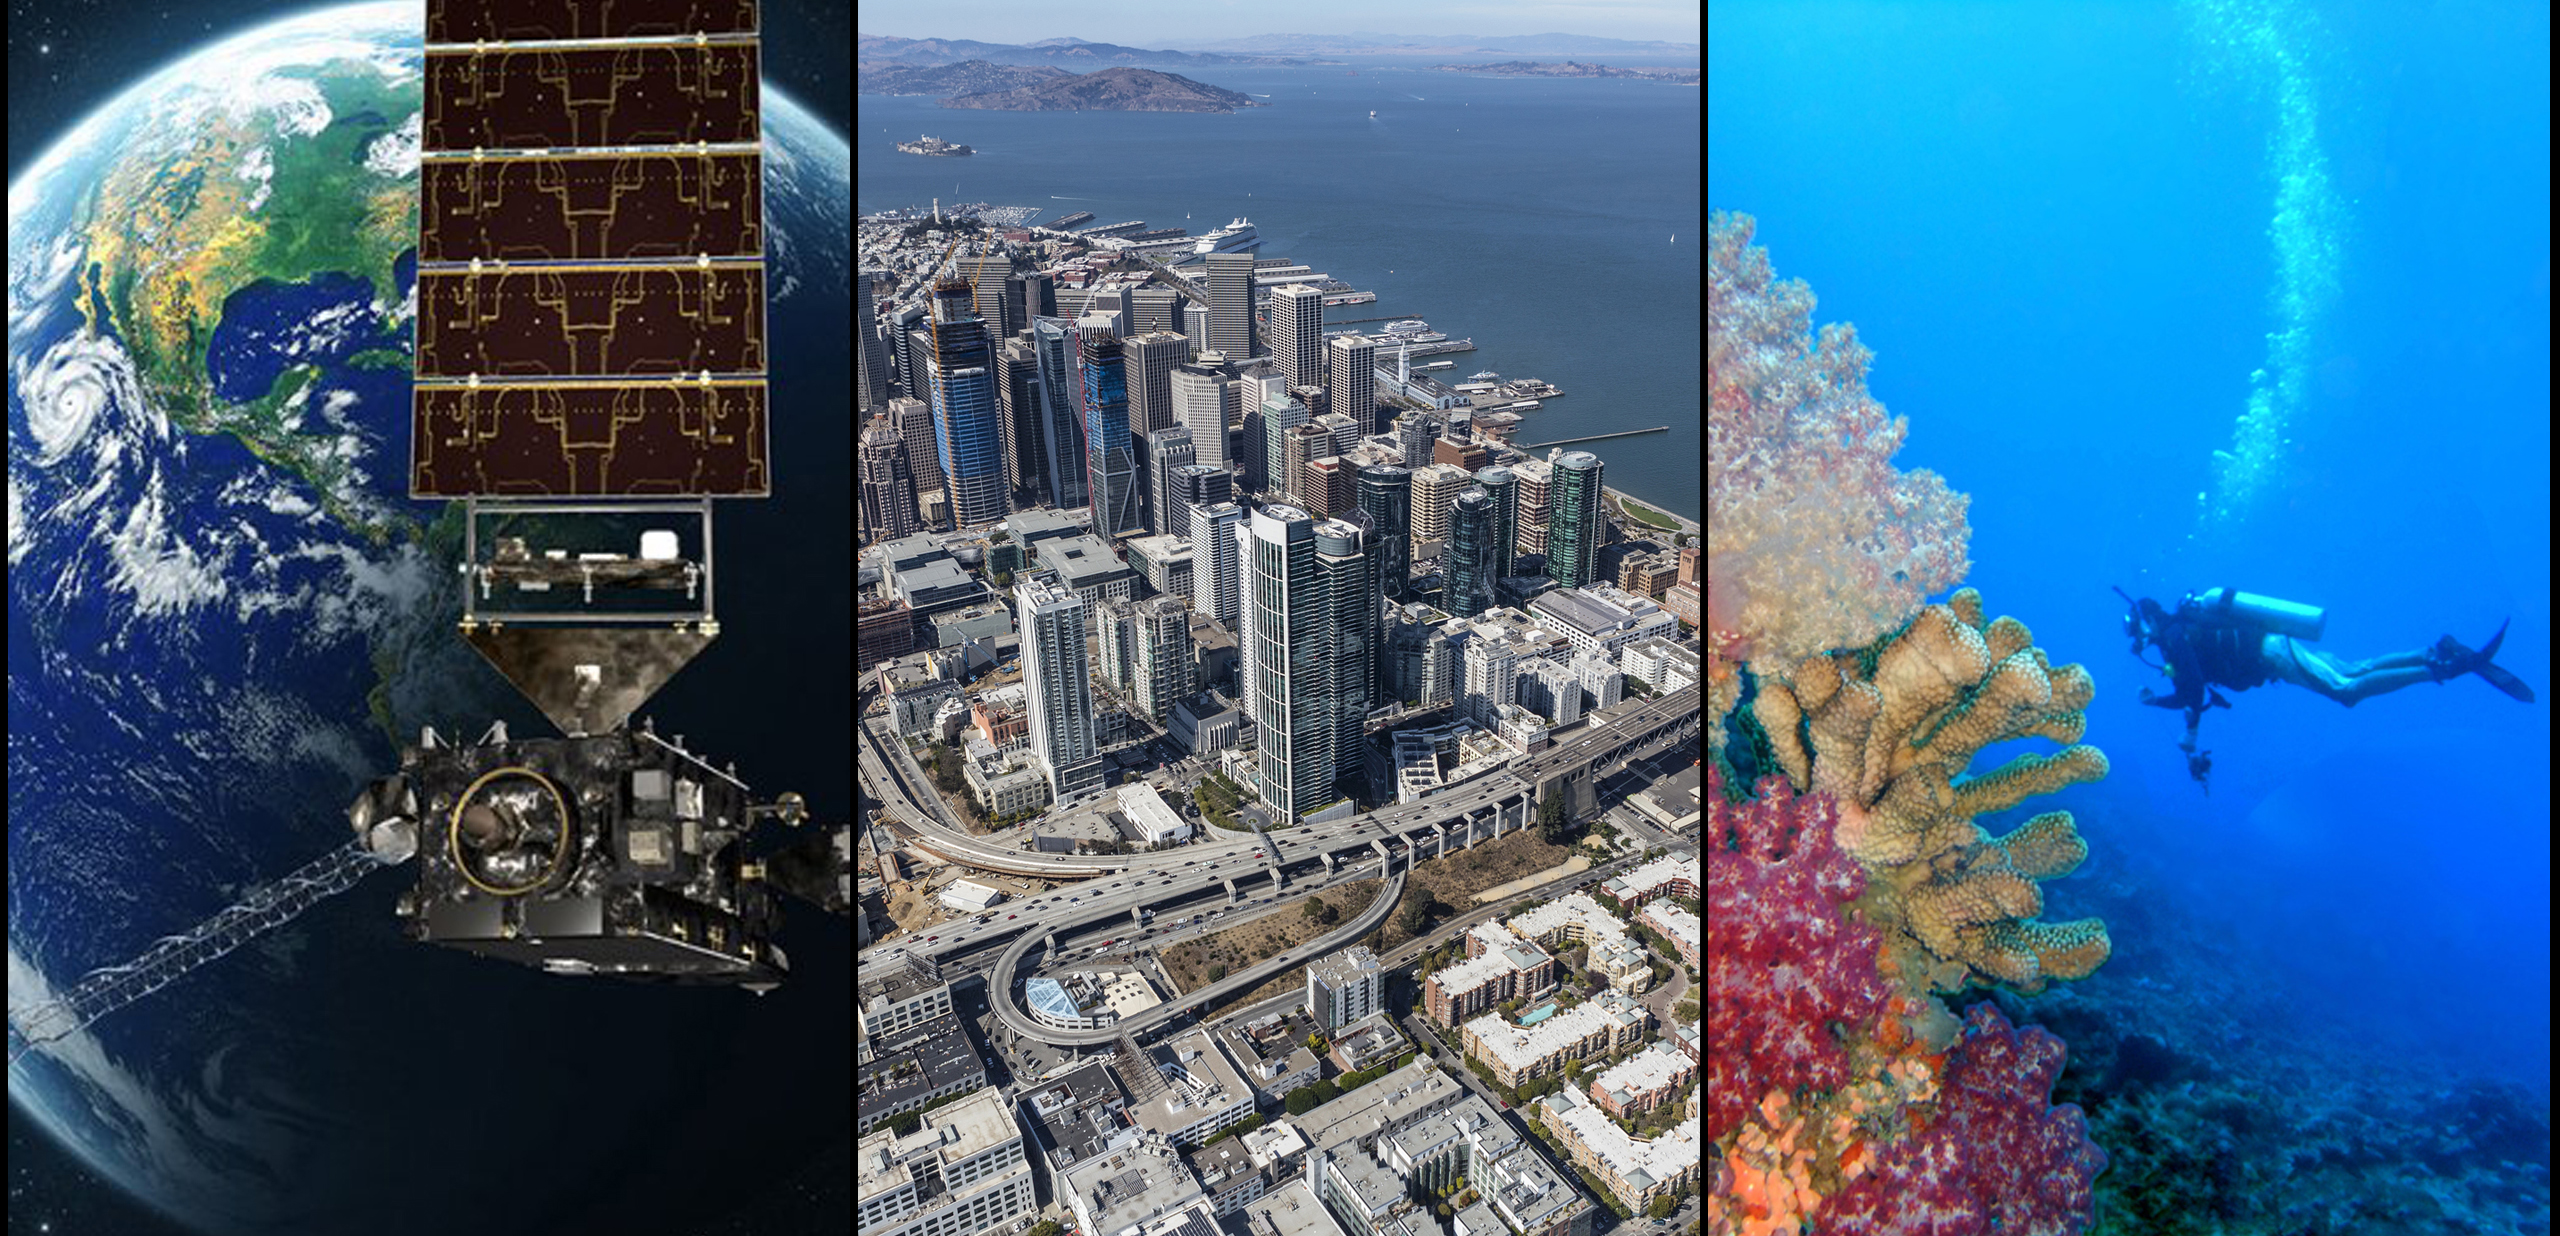
- NOAA data and other research are the backbone of NOAA’s weather products and services, providing a foundation for U.S. business investments in the weather sector that, in 2016, totaled $1.8 billion.
- The Climate Corporation, for example, sells agricultural consultant services and insurance based, in part, on NOAA products. (5)
- In 2013, Monsanto bought the corporation for nearly $1 billion. (6)
- Coastal communities are among our nation’s major economic engines, and NOAA brings a unique range of data, tools and other expertise to help them stay resilient.
- In 2013, economic activity in shore-adjacent U.S. counties accounted for:
- $7.6 trillion (46 % of Gross Domestic Product)
- 53.6 million jobs (40% of U.S. total)
- $3 trillion in wages (45 % of U.S. total)
- 3.8 million businesses (41% of U.S. total) (7)
- From mapping, monitoring and modeling, to on-the-ground and in-water restoration activities, NOAA leads efforts to manage and conserve coral reefs. These remarkable ecosystems provide significant benefits to coastal security and economies by:
- Buffering shorelines, dissipating 97% of the force of incoming waves (8)
- Averting flood damage estimated at $94 million annually (9)
- Contributing over $3 billion annually to local economies through diving, fishing and tourism activities (10)
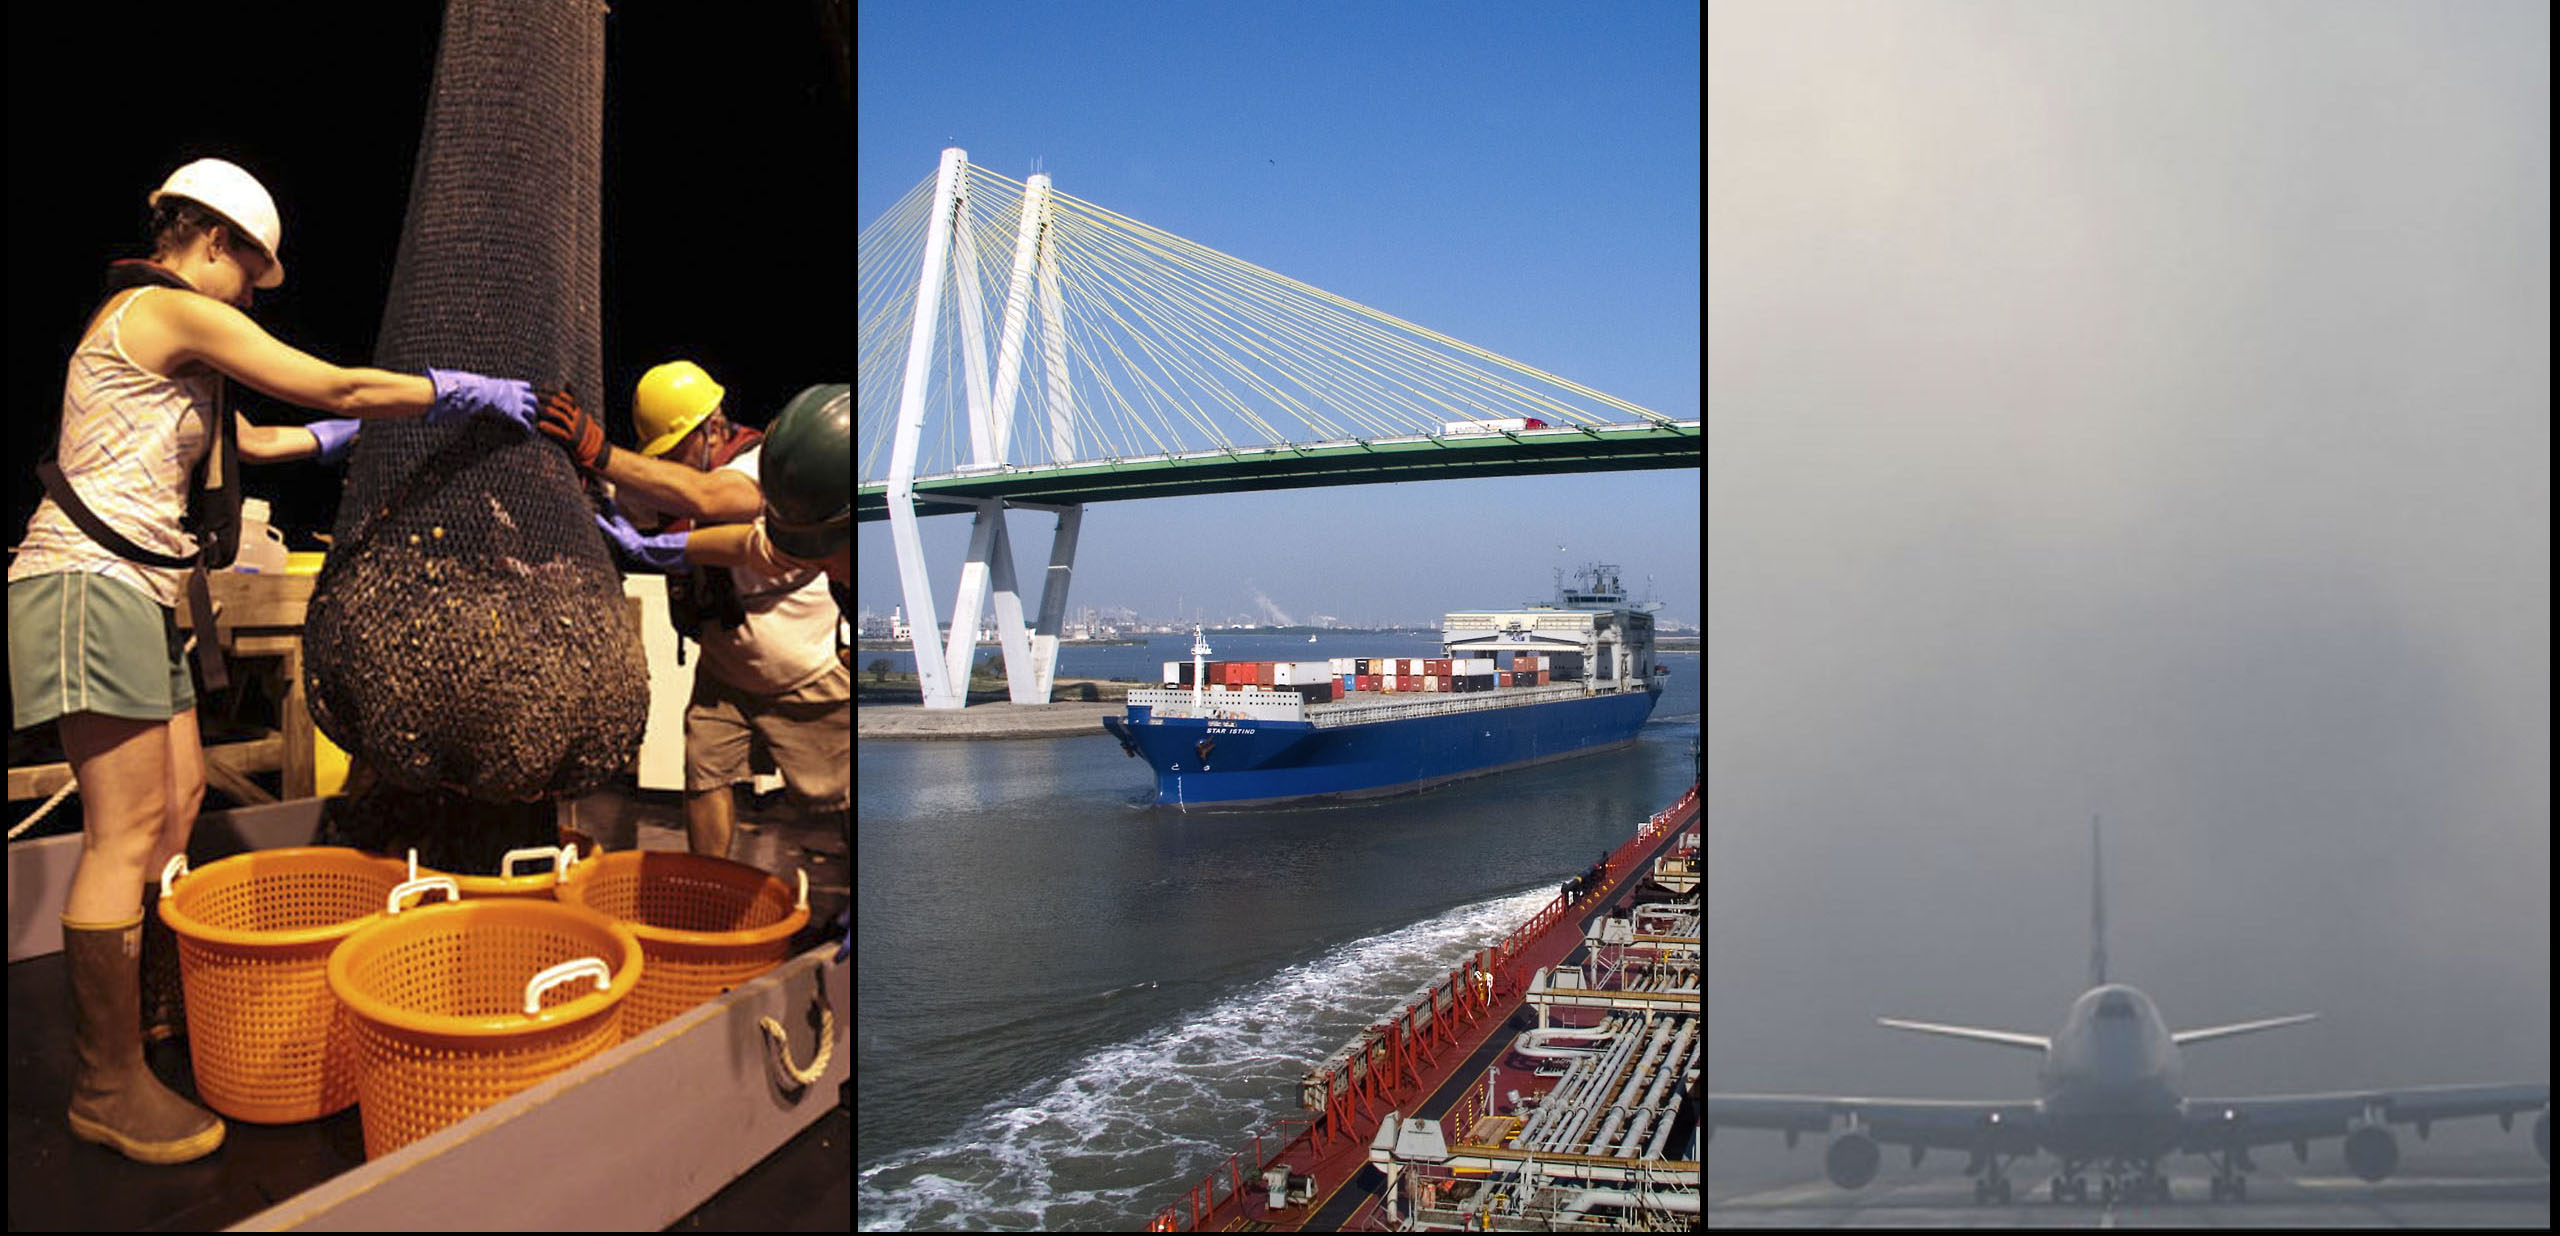
- Promoting sustainable fisheries is a core NOAA mission.
- In 2015, U.S. fisheries supported:
- 1.6 million jobs
- $208 billion in sales
- $62.4 billion in income impacts
- $96.6 billion in value-added impacts throughout the economy (11)
- NOAA’s nautical charts and real-time PORTS® system, which supports safe and efficient navigation at 28 U.S. ports, provided $1.2 billion in annual benefits, a 24 to 1 ratio of benefits to costs. Major benefits include:
- Less vessel delays
- Optimized port capacity
- Averted groundings and injuries
- Diminished pollution releases (12)
- Each year, weather is responsible for up to half of all U.S. aviation accidents (13) and about $1 billion in losses due to delays (14), underscoring the value of NOAA hazard warnings.
- Each day, NOAA’s Weather Forecast Offices provide nearly 600 airports with close to 2,500 aviation weather forecasts and about 1,300 inflight forecasts.
NOAA conserves and restores natural habitats
This includes combating marine debris, land-based sources of pollution, unsustainable fishing practices, and degradation of coral reefs, all serious threats to the ecosystems that this Hawksbill sea turtle and other marine life rely on for food and shelter.
NOAA has recommended 19 projects that will protect life and property, strengthen the economy, and conserve as well as restore coastal and marine resources.
Together, the projects will restore more than 1,000 acres of habitat and prepare over 350 coastal communities to better withstand extreme weather in 17 states and Puerto Rico.
Each $2 of federal funds will be matched by a non-federal contribution of at least $1, bringing total funding to over $22 million.

For public well-being and our economy, there is an urgency to NOAA’s work
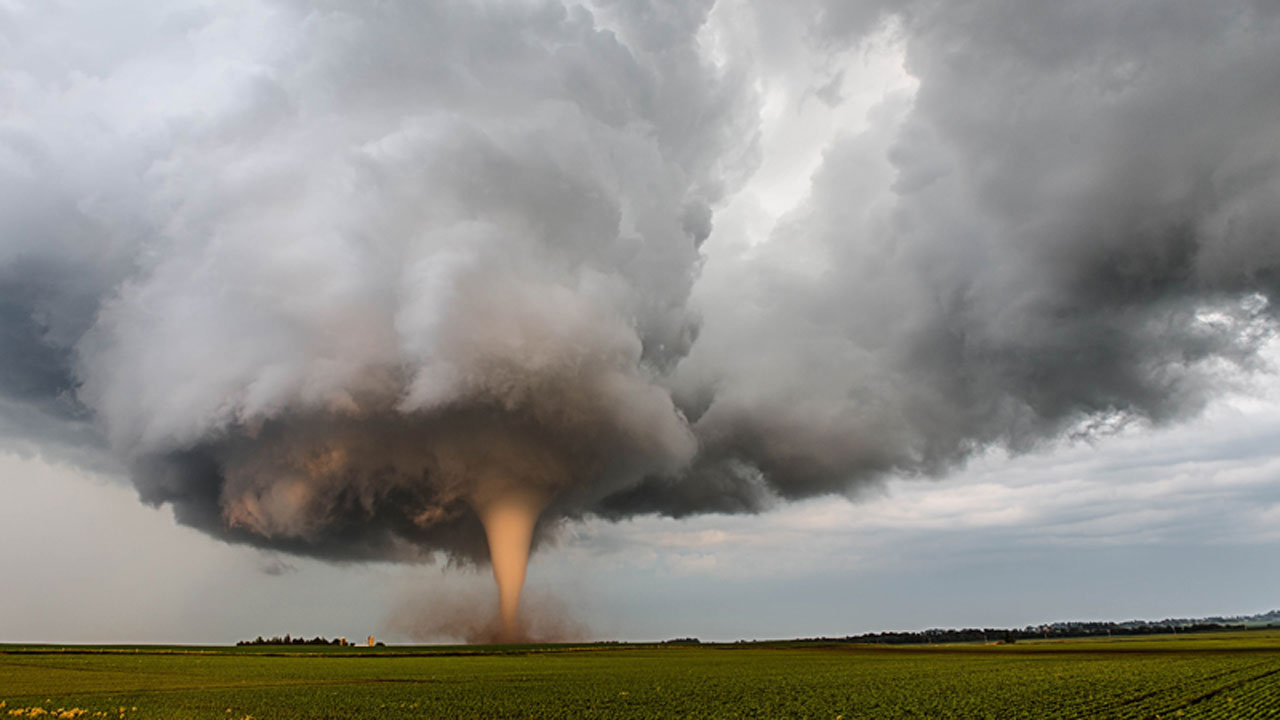
Weather variability has a vast impact on the nation’s economy. In 2008, the impact of this variability was estimated at $485 billion annually ($612 billion in 2016). (19)
Of the 12 most costly U.S. hurricanes in insurance history, 10 have struck between 2004 and 2012. (20)
In August 2016, Louisiana’s record rainfall and devastating floods destroyed 60,000 buildings. Over-all losses totaled $10 billion. (21)
In 2015, California’s severe drought led to wildfires across the state. Two wildfires alone caused $1.8 billion in damages. (22)
Even harsh winters are costly. 2014-2015 winter storms cost $4.6 billion, topping 2013’s substantial losses. (23)
Thanks to staff across NOAA for contributing to this report.
Cites1 Lazo, J. K., Morss, R.E. and Demuth, J.L. (2009). 300 billion served: Sources, perceptions, uses, and values of weather forecasts. Bulletin of the American Meteorological Society 90(6), 785-798.
2 Martin Associates. (2015, March). 2014 National Economic Impact of the U.S. Coastal Port System. Report prepared for the American Association of Port Authorities. Retrieved February 24, 2017, from http://www.aapa-ports.org/
3 National Marine Fisheries Service. (2016). Fisheries Economics of the United States, 2014. U.S. Department of Commerce, NOAA Technical Memorandum No. MFS-F/SPO-163, 237 p. Washington, D.C.: U.S.
4 U.S. Department of Commerce, Bureau of Economic Analysis. (2016). Gross Domestic Product by Industry Data. Retrieved March 20, 2017, from https://www.bea.gov/industry/gdpbyind_data.htm
5 U.S. Department of Commerce, Economics and Statistics Administration. (2014). Fostering Innovation, Creating Jobs, Driving Better Decisions: The Value of Government Data, p.15.
6 Edwards, Jim. (2013,October). Monsanto Pays $1 Billion for Big Data Company that Monitors Climate Change. Business Insider.
7 National Oceanic and Atmospheric Administration Office of the Chief Economist. (2016). Coastal Economy Pocket Guide. Retrieved February 24, 2017, from http://www.performance.noaa.gov/wp-content/uploads/Coastal- Economic-Pocket-Guide-113016.pdf
8 Ferrario, F., Beck, M.W., Storlazzi, C.D., Micheli, F., Shepard, C.C., and Airoldi, L. (2014). The effectiveness of coral reefs for coastal hazard risk reduction and adaptation. Nature Communications 5, article no. 3794. DOI: 10.1038/ncomms4794.
9 Spalding, M.D., Brumbaugh, R.D., and Landis, E. (2016). Atlas of Ocean Wealth.The Nature Conservancy. Arlington, VA.
10 National Ocean Service. (2014, March 12). How Do Coral Reefs Benefit the Economy? Retrieved February 24, 2017, from http://oceanservice.noaa.gov/facts/coral_economy.html
11 National Marine Fisheries Service. (2016). Fisheries Economics of the United States, 2015. (U.S. Department of Commerce, NOAA Technical Memorandum NMFS-F/SPO-163, Washington, D.C.
12 VOLPE National Transportation Systems Center, (2009) Valuation of the NOS Navigational Products (2009), Final Report Task 4-Benefit-Cost Analysis (BCA) Model Estimates.Intermodal Infrastructure Security and Operations Division (RVT-51), Center of Innovation (COI), Freight Logistics and Transportation Systems, Research and Innovation Technology Administration (RITA), U.S. Department of Transportation. Prepared for the National Ocean Service, under Reimbursable Agreement RA-VXD2. Dr. Hahar Barami, principle investigator, p.8.
13 National Oceanic and Atmospheric Administration (2007, April). Aviation Weather Forecasting: A History of Enhancing Air Flight Safety. Retrieved March 22, 2017, from http://celebrating200years.noaa.gov/foundations/aviation_weather/welcome.html#today
14 Bureau of Transportation Statistics. (2017). Understanding the Reporting of Causes of Flight Delays and Cancellations. Retrieved April 4, 2017, from https://www.rita.dot.gov/bts/help/aviation/html/understanding.html#q6
15 National Oceanic and Atmospheric Administration Office of National Marine Sanctuaries. (2015, June). Economic Impact of the Recreational Fisheries on Local County Economies in California’s National Marine Sanctuaries 2010, 2011 and 2012 (U.S. Department of Commerce, NOAA Marine Sanctuaries Conservation Series ONMS 2015-07) Washington, D.C.: U.S.
16 National Oceanic and Atmospheric Administration Office of National Marine Sanctuaries. (2014, January). Economic Impact of the Commercial Fisheries on Local County Economies from Catch in All California National Marine Sanctuaries 2010, 2011 and 2012 (U.S. Department of Commerce, NOAA Marine Sanctuaries Conservation Series ONMS-14-05) Washington, D.C.: U.S.
17 Samonte, G.P., Edwards, P.E., Royster, J.E., Ramenzoni, V.C. and Morlock, S. (2016). Socioeconomic Benefits of Habitat Restoration. U.S. Department of Commerce NOAA Technical Memorandum NMFS-F/SPO. p.73.
18 Narayan, S., Beck, M.W., Wilson, P., Thomas, C., Guerrero, A., Shepard, C., Reguero, B.G., Franco, G., Ingram, C.J. and Trespalacios, D. (2016, October). Coastal Wetlands and Flood Damage Reduction: Using Risk Industry-based Models to Assess Natural Defenses in the Northeastern USA. Lloyd’s Tercentenary Research Foundation, London.
19 Lazo,J.K., Lawson, M., Larsen, P.H., and Waldman, D.M. (2011). United States Economic Sensitivity to Weather Variability.Bulletin of the American Meteorological Society, p.710. DOI:10.1175/2011BAMS2928.1.
20 Munich Re. (2013, January 3). 2012 Natural Catastrophe Year in Review [PowerPoint Presentation], Slide 14. Retrieved February 22, 2017, http://bit.ly/2ua6xyS
21 Munich Re. (2017, January). Natural Catastrophes in 2016. Retrieved February 23, 2017, from http://bit.ly/2izBvuu
22 Munich Re. (2016, February 3). Natural Disasters: Golden State aflame. Retrieved March 24, 2017, from https://www.munichre.com/topics-online/en/2016/topicsgeo2015/california-aflame
23 Munich Re. (2014). 2013 Natural Catastrophe Year in Review [PowerPoint Presentation], slides 23 and 24. Retrieved February 22, 2017, from http://bit.ly/2tJxEyC
To view the original NOAA’s value to the U.S. economy story map, please see this version on the ESRI websiteoffsite link offsite link.


