Artistic inspiration comes from many sources — the human experience, nature, and even science. We challenged our NOAA scholars to get their creative juices flowing and share their internship experiences through art. Read, listen, and view the entries below to learn more about what the scholars did this summer.
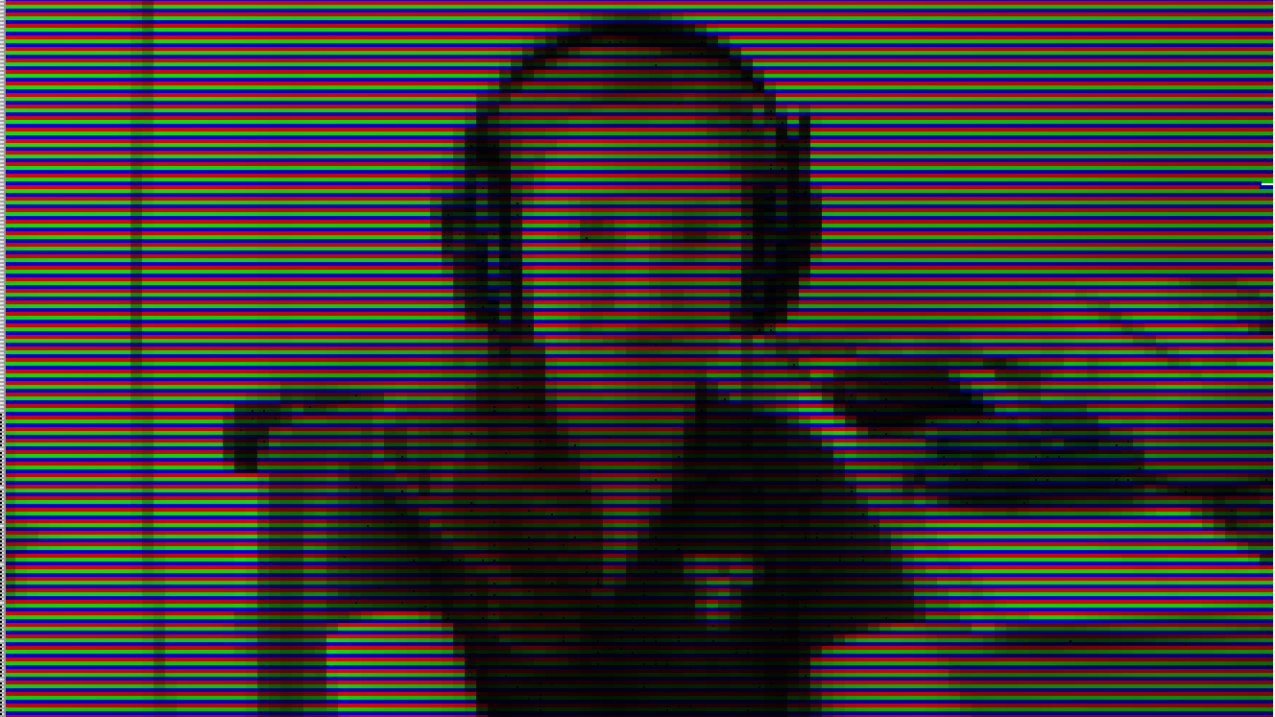
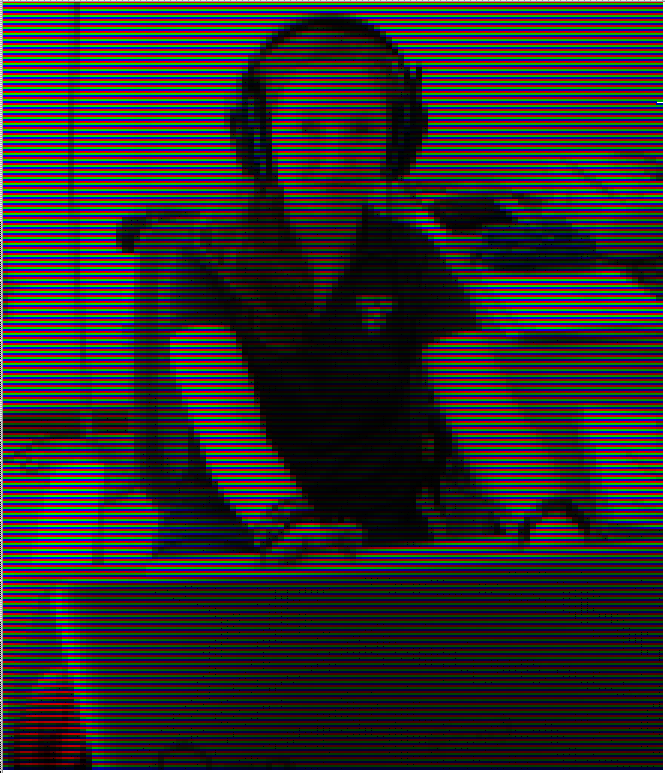
Natalie Vernon, a 2020 Hollings scholar entered a lot of data into spreadsheets for analysis during her internship. She commemorated the experience by creating a spreadsheet photo of herself entering data into a spreadsheet. (Image credit: Natalie Vernon)
Navigate the collection
- North Inlet Winyah Bay rap by Nadya Gutierrez
- A day in the life of a Hollings scholar video by Robbie Commodari
- West African Stargazer 3D animation by Leo MacLeod
- What causes seabirds to temporarily leave their nests? A comic by Helen St. John
- Digital spreadsheet art: Entering data into a spreadsheet by Natalie Vernon
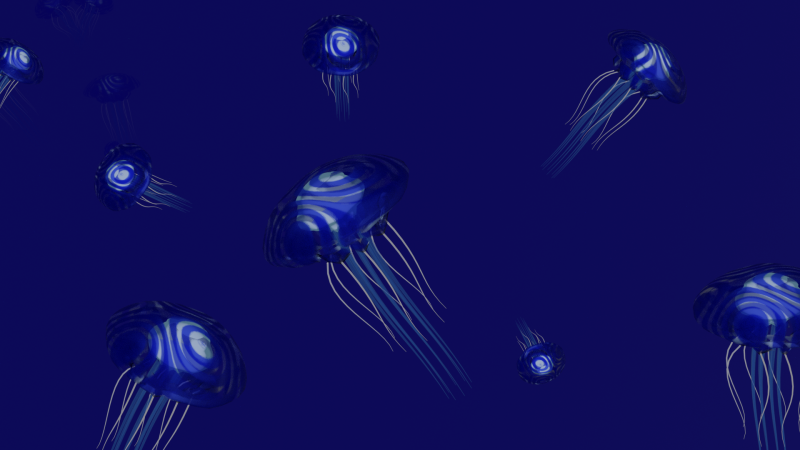
- Jellyfish in the water column. A 3D image by Quinn Girasek
North Inlet Winyah Bay rap by Nadya Gutierrez
Internship office and mentor: Office for Coastal Management, Chris Kinkade (NOAA mentor) and Robert Dunn (Onsite Mentor)
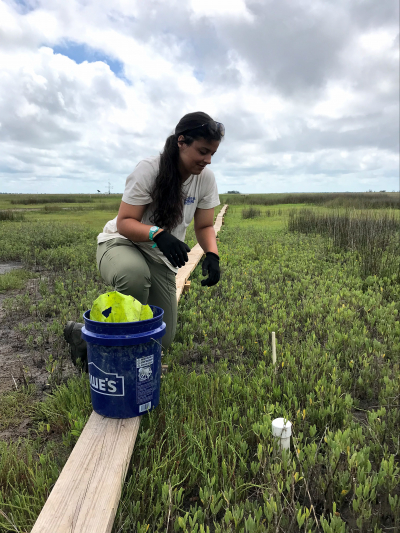
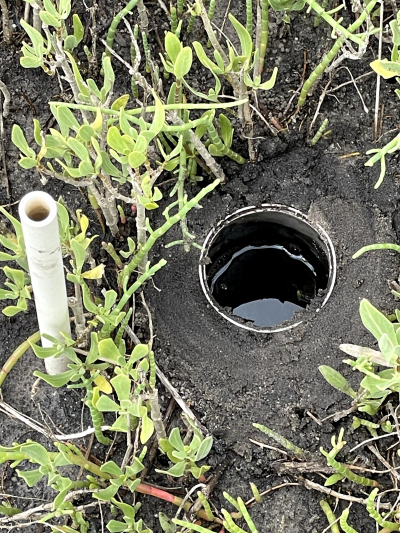
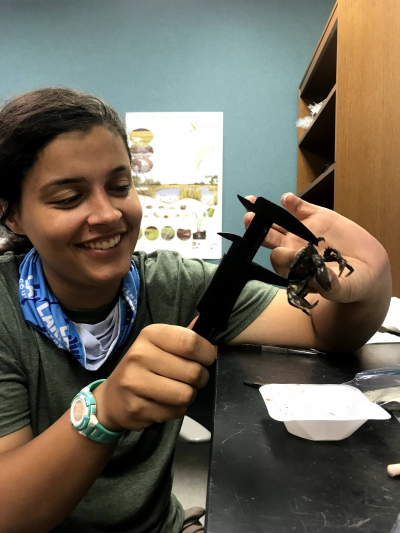
I worked at the North Inlet-Winyah Bay National Estuarine Research Reserve offsite link where I studied abundance of small-bodied marsh crabs at different time scales (daily, weekly, and monthly) and different elevations in the marsh. We made pitfall traps out of tennis ball cans, which catch crabs as they walk by, and buried them with the can opening flush with the soil for approximately 24 hours. We identified the crabs that we caught and used Excel and R programming software to analyze the data.
I started using music to convey scientific information in high school when I wrote a song about the 12 soil orders to help me remember the difference between the soil orders. I was able to perform that song at graduation, and since then, music has been one of my favorite ways to engage the community in science. I hope that you enjoy the rap!
A day in the life of a Hollings scholar video by Robbie Commodari
Internship office and mentor: National Weather Service Memphis Forecast Office with Thomas Salem
This summer, I completed an internship under Thomas Salem at the National Weather Service Memphis forecast office and also trained for my first Ironman Triathlon. For the project, I looked at changes in rotational velocity in tropical cyclone tornadoes. More specifically, I investigated tropical cyclone tornadoes that impacted the Mid-South region, located just above the central Gulf Coast states, and compared my data to the tornadoes produced by Hurricane Harvey. Similarities were found between rotational velocity values in the Mid-South tropical cyclone tornadoes and the Harvey tornadoes. These similarities could potentially help forecasters better understand what to look for on radar in the midst of tropical events where tornadoes might be a threat.
Preparing for the Ironman while completing the internship made me realize how important it is to implement the lessons I have learned from triathlon training to the work I do. The many hours I spent training while not working on the project allowed me to make several connections among different aspects of the project. In my video, I take you through a day in my life this summer, from training for the Ironman to working on my Hollings project.
West African Stargazer 3D animation by Leo MacLeod
Internship office and mentor: The Smithsonian and NOAA National Systematics Lab with Kate Bemis, Ph.D. and Murilo Pastana, Ph.D.
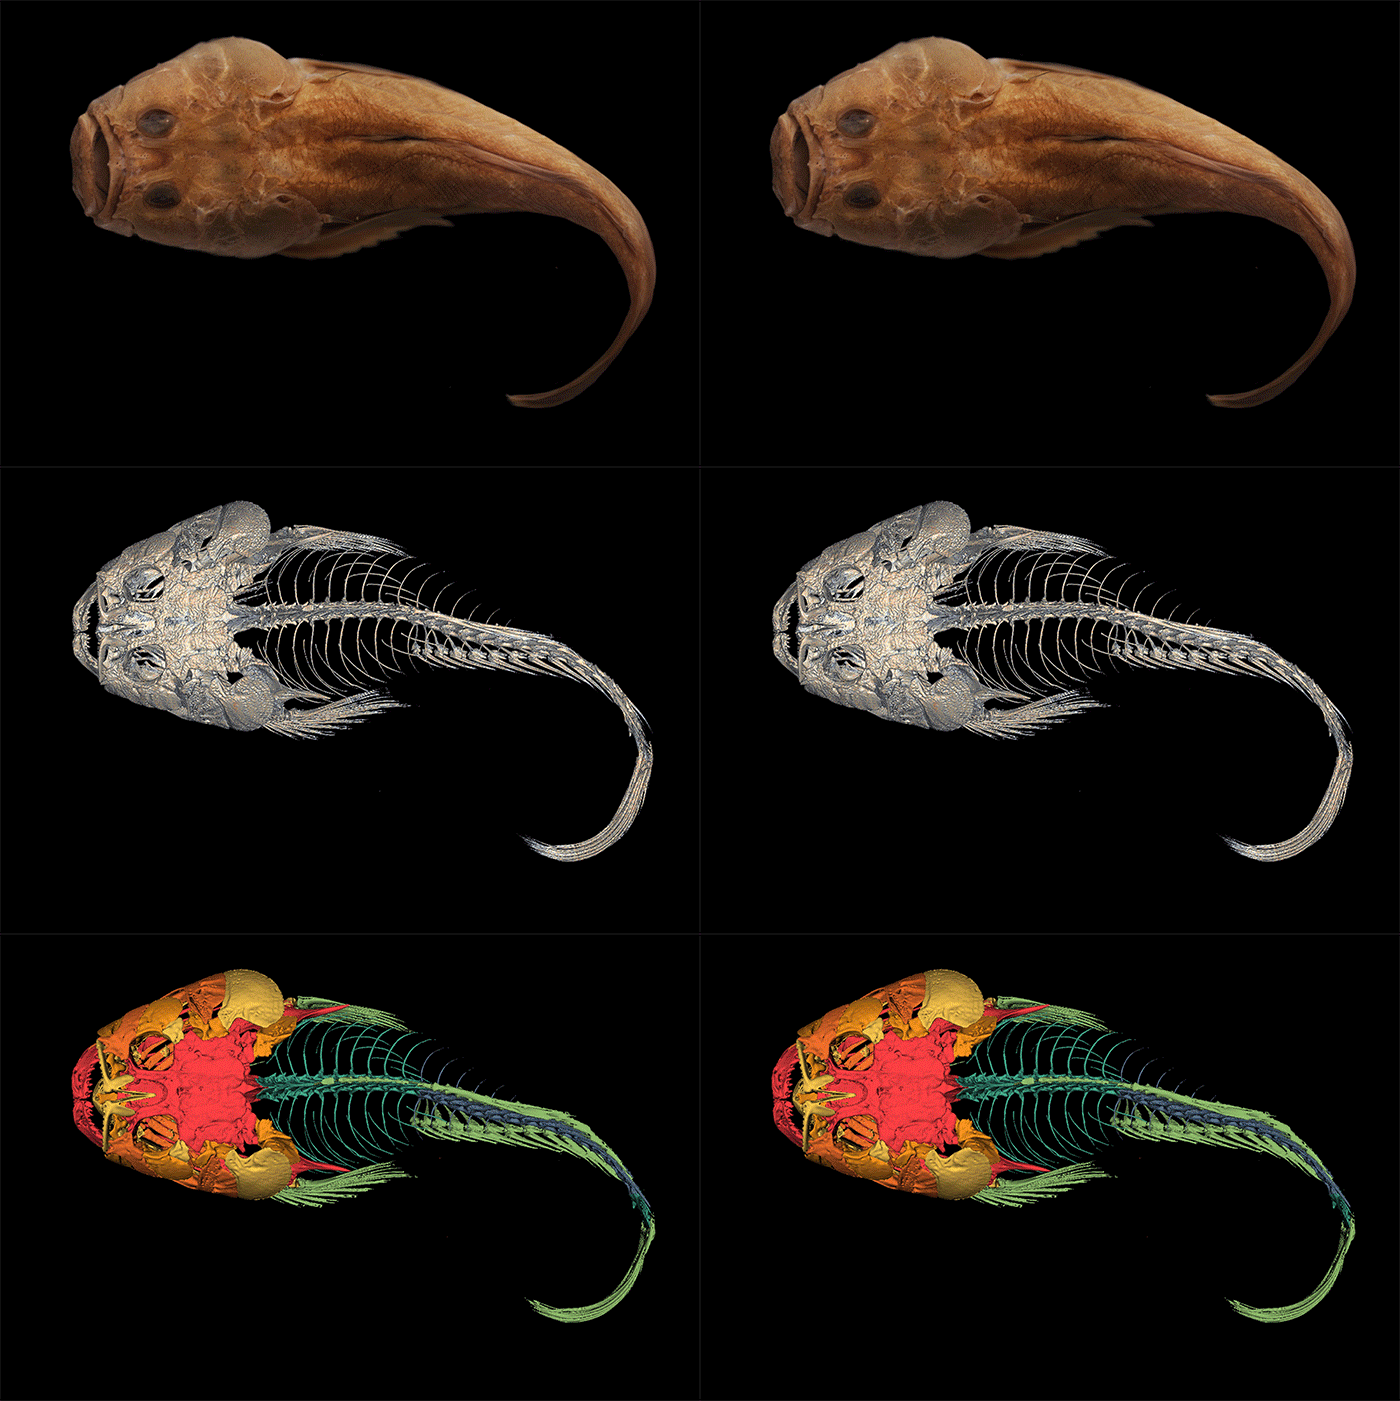
Outside of the original species description, no papers have described the anatomy of Uranoscopus cadenati, the West African Stargazer fish. They are often caught in bottom trawls as bycatch and are sold in fish markets. For my internship at the Smithsonian and NOAA National Systematics Lab, I worked to illustrate each component of the skeleton of U. cadenati using micro-computed tomography (µCT) scanning. The 3D render produced through µCT allows for the segmentation of each bone. The µCT is much like a larger CAT (CT) scan you would get at a hospital, but it allows us to sample smaller specimens without damaging them. The data provided in this study will serve as a reference for future osteological studies in this genus and family. The colors indicate skull (reds) and the rest of the skeleton (blues).
I chose this art project because my project was already very art focused since it is an osteological description. The format of a gif moving between all the levels of the specimen I worked on seemed like an interesting way to show how much data can be gathered through this technique.
What causes seabirds to temporarily leave their nests? A comic by Helen St. John
Internship office and mentor: Rookery Bay National Estuarine Research Reserve offsite link, with guidance from Collette Lauzau, Jeff Carter, and Nina Garfield
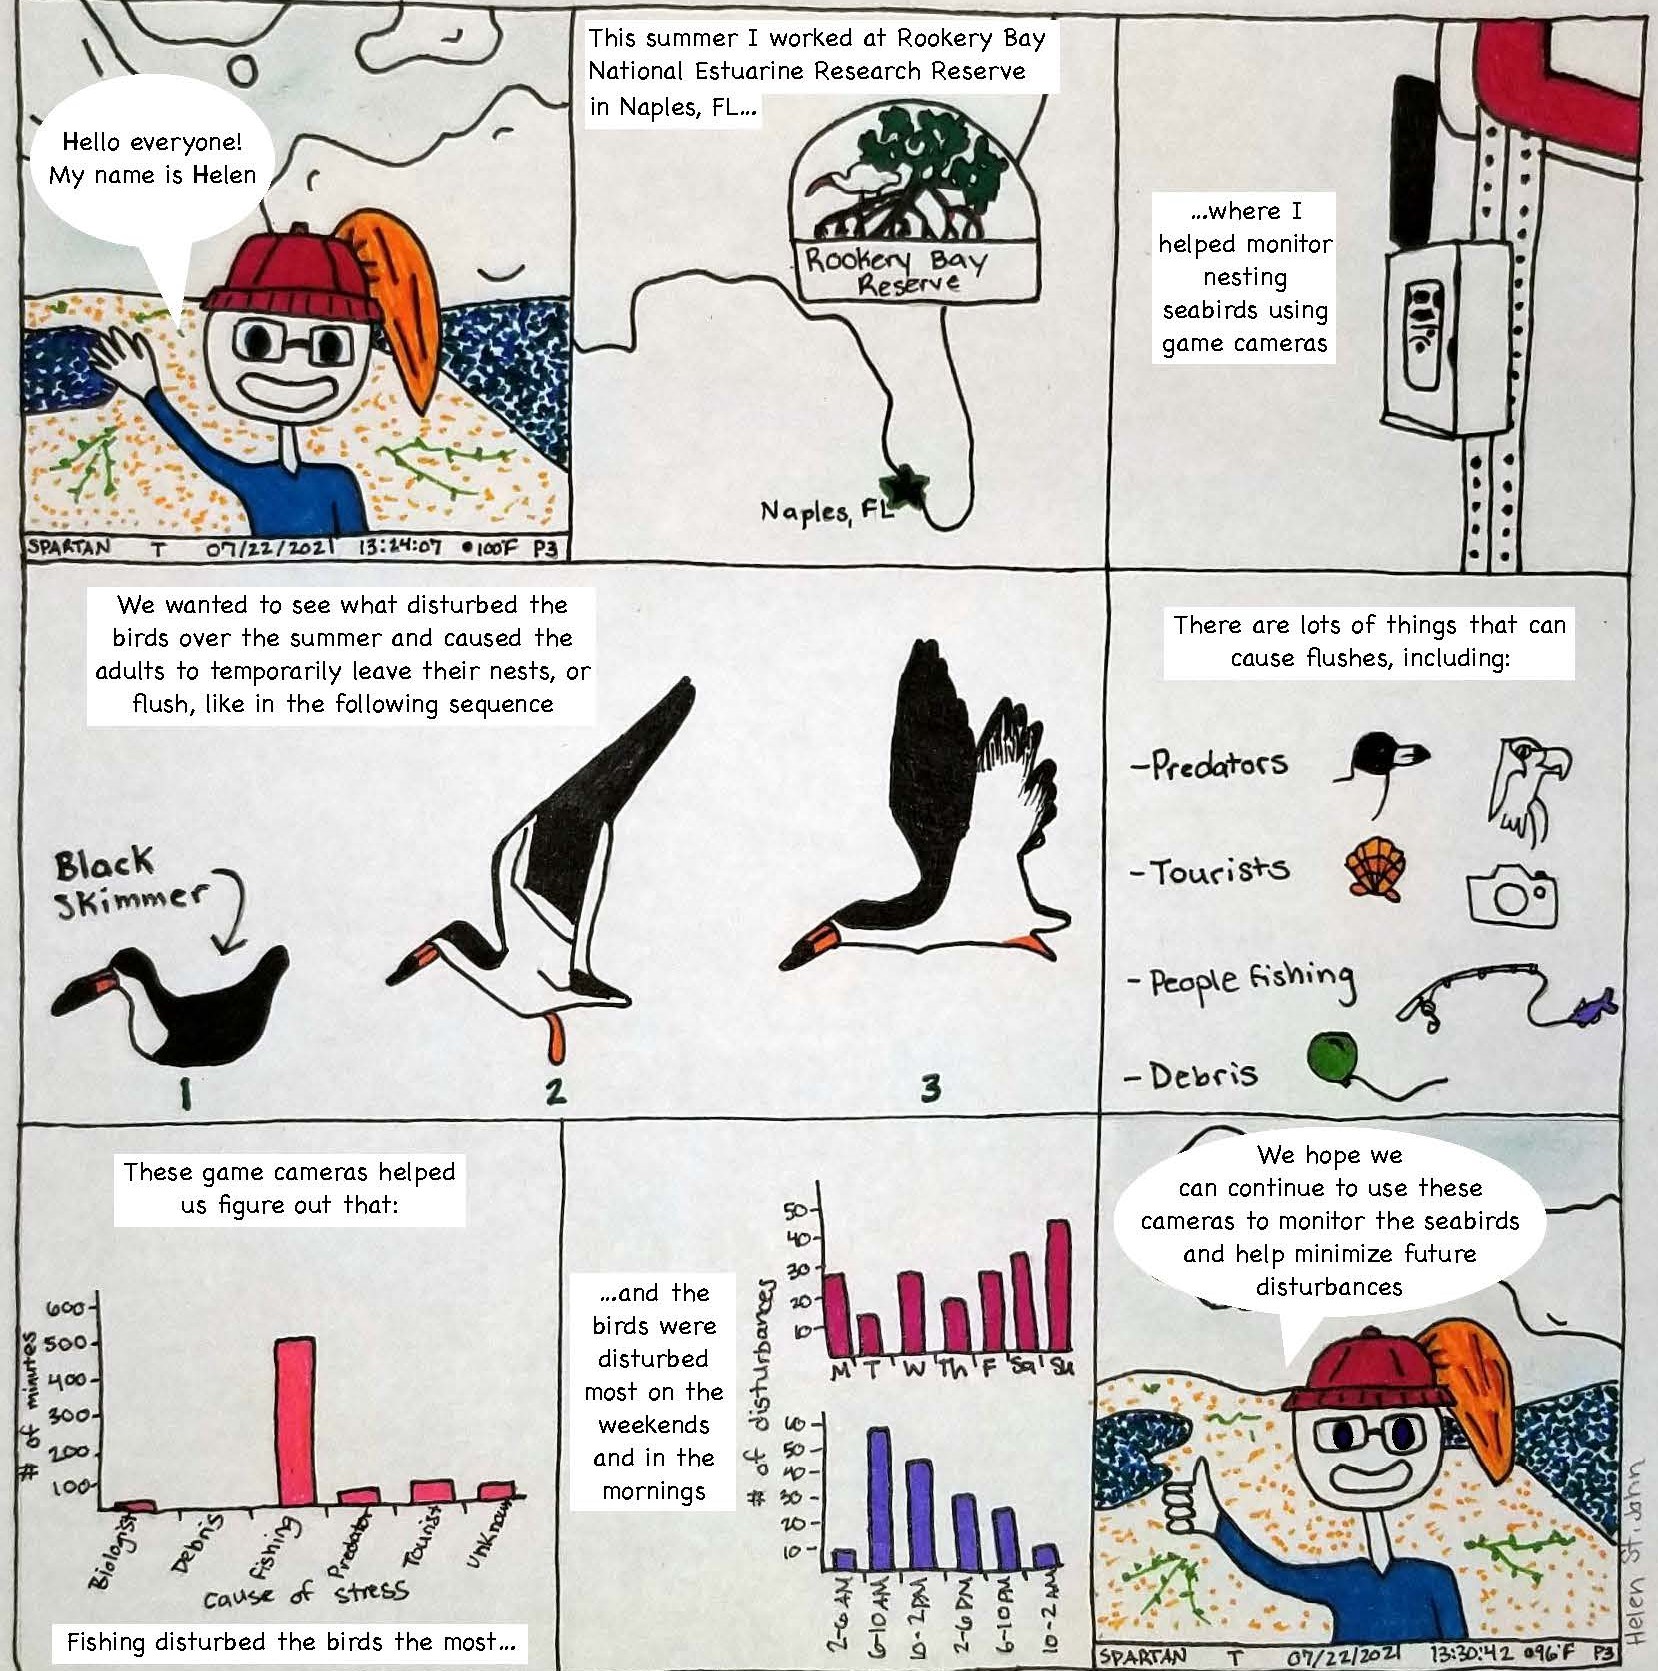
Second Chance, a sandbar in the Rookery Bay National Estuarine Research Reserve of southwest Florida, is used as a nesting site by protected seabirds each summer. We couldn't be on the island 24/7, so we used Spartan GoCam cellular game cameras to wirelessly monitor birds on Second Chance for disturbances, or anything that causes the birds to temporarily leave their nests. This summer, we found that disturbances occurred most often in mornings and on weekends, and that fishermen had the greatest impact on the colonies. Creating the following comic helped me think about how to concisely discuss my project and gave me a chance to be more creative in my presentation of information.
Comic description
- Panel 1: A drawing of a girl in front of a beach area. A speech bubble reads "Hello everyone! My name is Helen."
- Panel 2: A drawing of a map showing that Rookery Bay Reserve is located on the bottom left coast of Florida. Text reads "This summer I worked at Rookery Bay National Estuarine Research Reserve in Naples Florida..."
- Panel 3: Text reads "... where I helped monitor nesting seabirds using game cameras." There is a drawing of a game camera.
- Panel 4: Text reads "We wanted to see what disturbed the birds over the summer and caused the adults to temporarily leave their nests, or flush, like in the following sequence." The drawing shows a sequence of a Black Skimmer bird flying away from its nest in three steps.
- Panel 5: Text reads "There are lots of things that include flushes including predators, tourists, people fishing, debris." Next to each factor there is a simple icon drawing representing the factor.
- Panel 6: A graph shows that biologists, debris, predators, tourists, and unknown factors cause birds to be gone from their nests for less than 100 minutes, while fishing causes them to be away for approximately 500 minutes. Text reads "These game cameras helped us figure out that fishing disturbed the birds the most...".
- Panel 7: Text reads "...and the birds were disturbed the most on weekends and in mornings." Two graphs are on the panel. One shows that birds are disturbed about 40 times on Sundays and 30 times Friday and Saturday, while the rest of the week is closer to 10-20 times. The second graph shows that they are disturbed around 60 times between 6-10 am, and then disturbances decrease throughout the day and night.
- Panel 8: A drawing of the girl on the beach again. A speech bubble reads "We hope we can continue to use these cameras to monitor the seabirds and help minimize future disturbances."
Digital spreadsheet art: Entering data into a spreadsheet by Natalie Vernon
Internship office and mentor: National Weather Service, Columbia South Carolina Forecast Office with Frank Alsheimer
This summer, I conducted a research project examining the effectiveness of the Warn-On-Forecast System in predicting severe weather events in the Carolinas. I went through storm reports and noted parameters like the size of hail, wind speed, and amount of rain, and compared them to the Warn-On-Forecast System forecast. This was to see how effective the system was at predicting these events. This project involved a lot of data collection and construction of a copious number of spreadsheets. So, because I spent my summer on the computer entering data into spreadsheets, why not make a picture of myself making spreadsheets in a spreadsheet? To make the image, I used a website made by Matt Parker, a stand-up Mathematician, where you can upload a photo and convert it into an Excel spreadsheet.
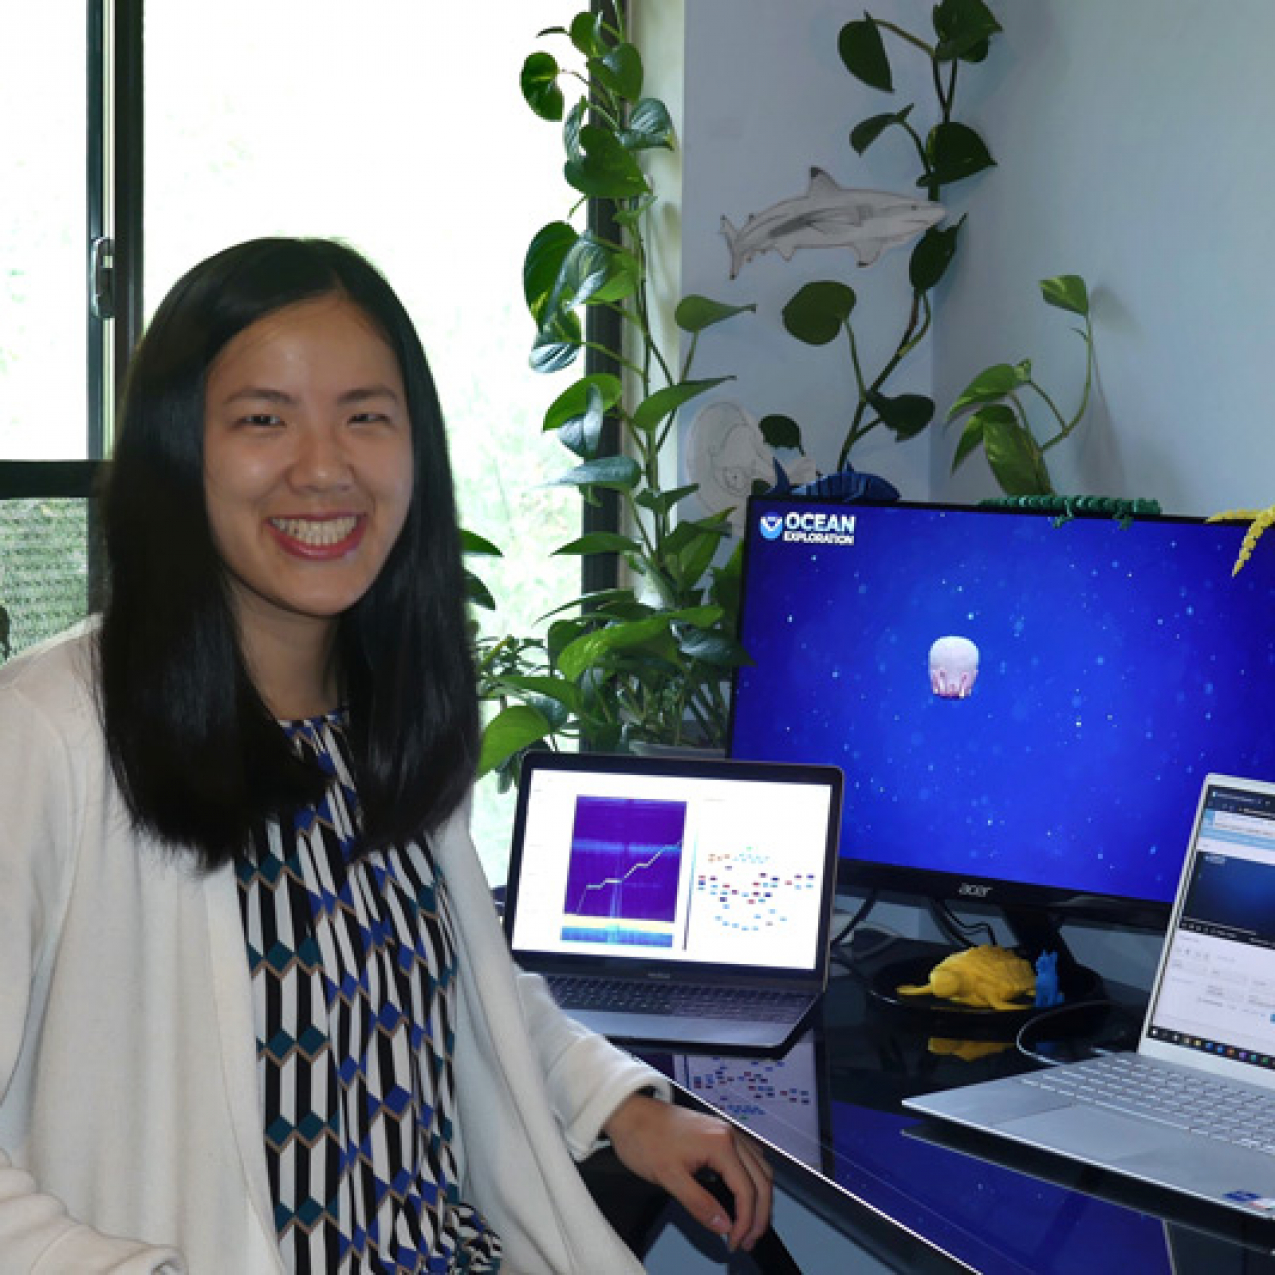
Jellyfish in the water column. A 3D image by Quinn Girasek
Internship office and mentor: Ocean Exploration, Adrienne Copeland and Mike Ford
This summer, I worked with NOAA Ocean Exploration to investigate mesopelagic organism abundance in the Gulf Stream and Deep Scattering Layer, an acoustically dense region where mesopelagic organisms are highly abundant due to light differences and predator avoidance. To conduct this research, I used a variety of data types (e.g. acoustic, imagery, and satellite) and several programs (e.g. ArcGIS, Echoview, R, and SeaTube). Part of my experience included participating in a water column dive, which took place on July 28, 2021. During the dive we saw many fish and jellyfish, including a few undescribed species and a potentially new species! View examples and images of each of these in the dive summary I contributed to. In the 3D image below, several generic jellyfish are moving about in the water column. I made the jellyfish in Blender, an open-source 3D computer graphics software. The colors and designs were created using different shading modifiers, such as textures, color ramps, and mapping properties (see the screenshot below for details). To learn more about the dive and what we found, read my expedition feature.
