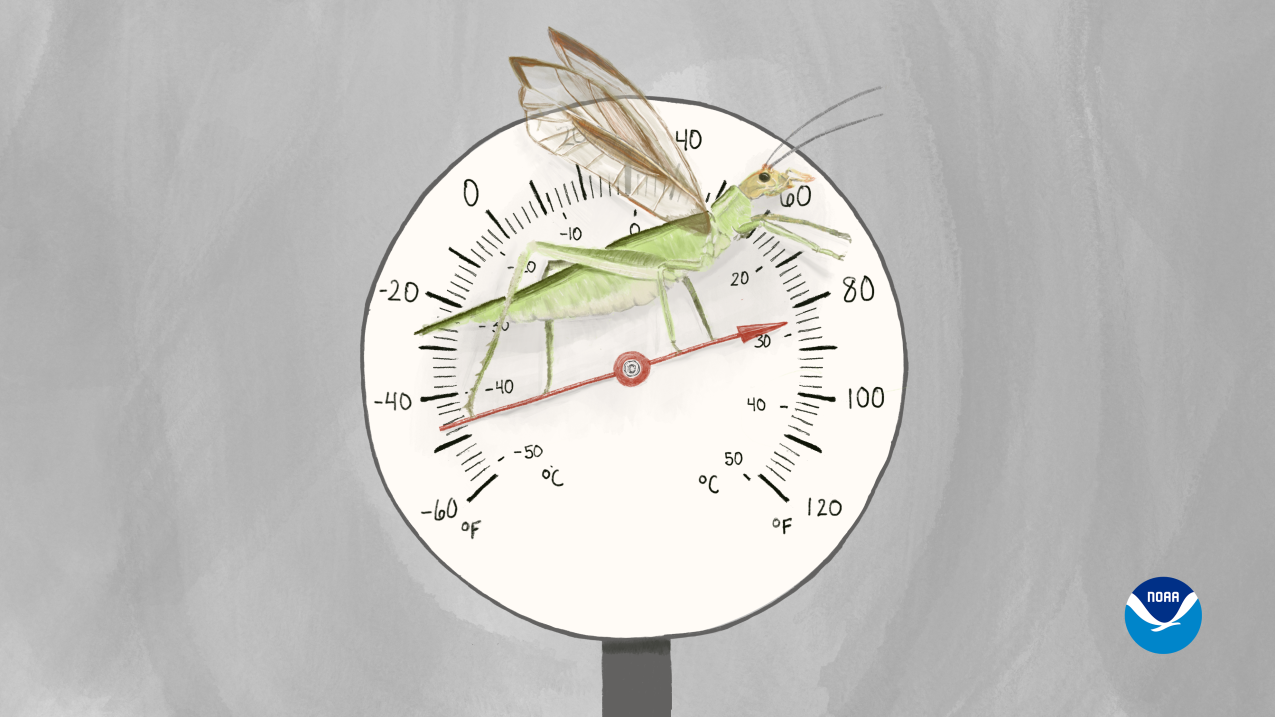
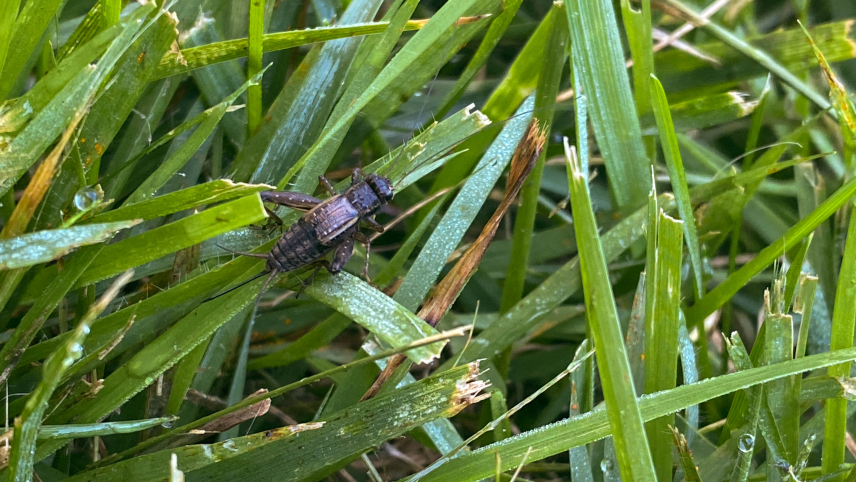
The rate of cricket chirps, which male crickets make with their wings, correlates to the temperature in their surroundings. Snowy tree crickets, as represented artistically here, are nicknamed "the thermometer cricket" for their accuracy. (Image credit: NOAA Office of Education)
Can crickets tell the temperature? The answer is in their chirp!
Using crickets as a thermometer
Beyond Dolbear's law
Follow-along experiment: Collecting data
Follow-along experiment: Calculate
Conclusion
For many people, opening their windows to a chorus of crickets is a hallmark of summer nights and fall mornings, but did you know that their symphony can also be used as a thermometer? By counting the frequency of their chirps, you can estimate the temperature with arithmetic!
Much like a sluggish bumble bee on a cool spring morning or a lizard sunning on a rock, crickets move slower in cooler temperatures. This is because each of these animals is an ectotherm — their body temperature depends on the temperature of their environment. As crickets warm, they can rub their wings together faster, which is how male crickets make the nightly repetitive chirp they use to attract mates.
The relationship between cricket chirping and temperature has been noted for a long time. In Western science, it is called Dolbear’s law after the most widely referenced early publication on the phenomenon published in 1897 by Amos Dolbear. His observations showed that you can count the number of chirps per 15 seconds, add 40, and that will give you the temperature in Fahrenheit (F).
Dolbear's law
Temperature (F) = number of cricket chirps in 15 seconds + 40
The El Paso, Texas Weather Forecast Office makes calculating the temperature even easier by providing a cricket chirp converter based on Dolbear’s law! Just plug in the number of chirps and it will convert the number to a temperature in degrees Fahrenheit, Celsius, or even in Kelvin (you do you!).
While using Dolbear’s law is a neat party trick, if you really want to impress your friends, figuring out the formula for the crickets in your own neighborhood can make your estimate even more accurate.
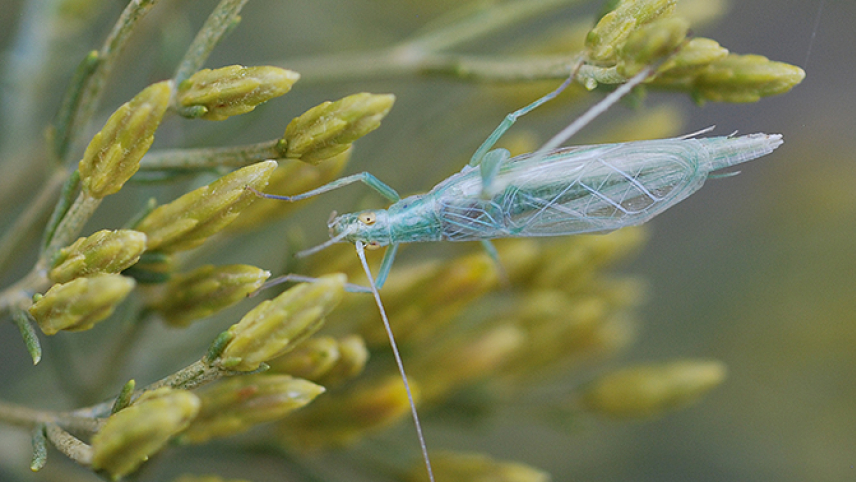
Different cricket species may work best with a different formula for temperature, or could be more or less accurate than another species. Dolbear didn't identify what species of cricket his formula referenced, but many people think that offsite link he counted the chirps of the snowy tree cricket, which is now nicknamed “the thermometer cricket,” for its accuracy as a thermometer. Factors like how close the crickets are to a warm building or what region you live in can impact the formula that best predicts temperature based on cricket chirps. One way to account for your unique situation is to calibrate your own cricket thermometer!
To do this, you’ll need to count cricket chirps at several different temperatures and record the results. Then you can plot the points on a graph and draw a line that goes through the most data points. Once that is done, you can calculate the best formula for predicting temperature using cricket chirps in your area. Follow along with our example on the next tab, either by hand or using a computer spreadsheet program!
Things to consider before you start
Before you hop into your experiment, there are a few things to think about beforehand.
- You can plan to do your experiment all in one day or over multiple days.
- In one day: Plan ahead by looking at your hourly temperature forecast at weather.gov. First, look up your forecast, then scroll down to “Additional forecasts and information,” and choose “hourly weather forecast” or “tabular weather forecast.” That way, you can begin at a time where the temperature will be dropping or rising.
- Over multiple days: Try to choose days with similar weather conditions. That way you reduce how varying conditions, like rain or drought, might affect cricket chirps.
Expand to see a screenshot of weather.gov

- Decide whether you are going to count crickets once at each temperature or multiple times. Or if you might have someone else join you and count separately to make sure you both get the same result.
- Often scientists take more than one measurement to make sure they get a precise result.
- By having someone else count at the same time, you may have greater accuracy. Read more about accuracy and precision in science.
Step 1: Observe
The first thing you will need to do is decide which cricket chorus you want to count — often multiple groups are calling at once. For example, you may hear two groups, one far away and one close. Or, perhaps there are multiple species of crickets, one group singing high like the sopranos in a choir and another that sings a lower note. The scientist in you may be thinking that counting the same individual cricket’s chirps would be more precise, but listening to a single cricket is often hard since groups tend to synchronize.
- Listen to the choruses of crickets around you. Can you pick out different groups of crickets singing?
- Once you feel confident that you can pick out the different groups of crickets, choose one of them to count for your thermometer.
Tip
Record your decision so you remember if you take a break or want to repeat your experiment later. Here is my example: Date: 7/28/22. Time: 8:00pm. I heard 2 groups of crickets, one high and one low. I am going to listen to the high-pitched group of crickets because they are the easiest for me to count.
Step 2: Record
Now that you’ve identified your chosen chorus, you’ll need to make a data table and collect your data.
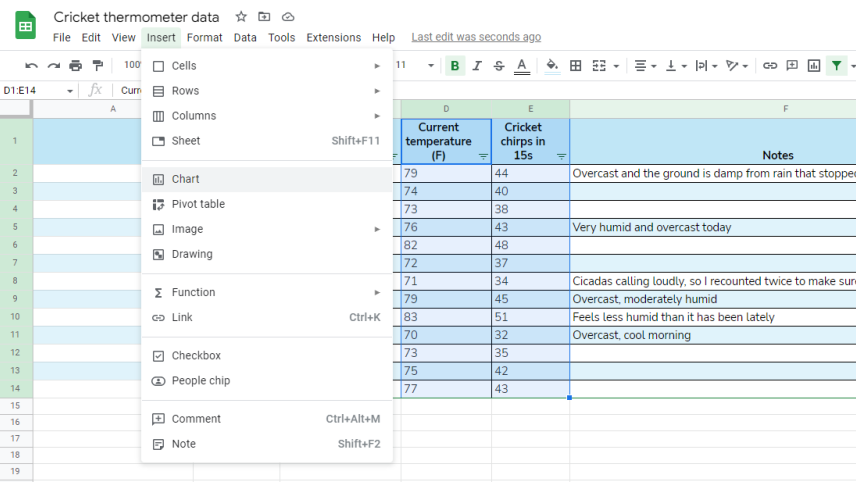
- First, make a data table by hand or in a spreadsheet program on a computer. Put the following columns in your data table: Date, time, current temperature, cricket chirp count, notes (see photo below for our data table).
- When you are ready to begin your first count, record the date and time in the appropriate columns in the table. Then, look up the current temperature or, if you have an outdoor thermometer nearby, you can use that to record the temperature.
- Now, set a timer for 15 seconds and count the number of chirps you hear from your chosen group of crickets.
Tip
If you have a mobile device handy, you can try staying silent and recording for 15 seconds and writing the data in your table later.
Step 3: Repeat
To calibrate your cricket thermometer, you will need to repeat step 2 at multiple different temperatures. Otherwise, all you would know is how often crickets chirp in that specific moment!
- We recommend recording cricket chirps for at least 10 unique temperatures.
- Choose clear weather for nights that you count crickets; that way, you eliminate the possibility of precipitation affecting your results.
Tip
Take notes about weather conditions in your “notes” column. You could also record things like whether there is a lot of background noise from traffic or other animals, for example. If anything completely interrupts your count, like a car driving by or someone talking loudly, make sure to start over.
Our data table
Step 4: Calculate
Now for the fun part — plot your data and calculate your cricket thermometer equation! You can do this part either by hand or in a spreadsheet program. Follow along with whichever method you prefer.
In both examples, we are plotting data and drawing a line of best fit, or a line that goes through the most of our data points. Then, we find the formula for that line, which also serves as the cricket thermometer formula. The formula for a line is y = mx +b, where:
- 'm' is the slope
- 'b' is the y-intercept
- 'x' and 'y' are coordinates for a point along the line. In our case, x is the number of cricket chirps and y is the temperature.
So, you can read the formula as: Temperature = number of cricket chirps in 15 seconds * m + b
Now, onto finding your slope (m) and y-intercept (b)!
In a spreadsheet program
For this example, we are using Google Sheets, but other spreadsheet programs, such as Microsoft Excel, can also be used.
- Enter your data into the spreadsheet
- Select your “current temperature” and “cricket chirp” columns
- Go to the “Insert” menu and select “chart”
Expand to see screenshot of inserting a chart
- Double-click on your chart. The chart editor sidebar will open.
- In the “setup” menu (shown on the left in the image below):
- For chart type, select “scatter”
- Set chirps as the x-axis and temperature as the series
- In the “customize” menu (shown on the right in the image below):
- Select “series” and check the “add trendline” box
- Trendline type should be linear
- In the “label” dropdown, select “equation”
- Select “series” and check the “add trendline” box
- In the “setup” menu (shown on the left in the image below):
Expand to see screenshot of the chart editor

The equation at the top of the chart is your cricket thermometer! You can put any number of cricket chirps in place of the “x” and find the temperature.
By hand
If you don’t have access to a computer, you can do this calculation by hand, but it is a bit more work! Follow the instructions below. These instructions assume some graph-making experience, so If you aren’t very familiar with making graphs and plotting data, make sure to work with someone who can help you.
- First draw your X and Y axes.
- Your X and Y axes should start with a number a few below your lowest measurement (this will make later steps easier).
- Make sure your axes go up by the same interval between each mark, for example label every number or every other number.
- Then plot your data.
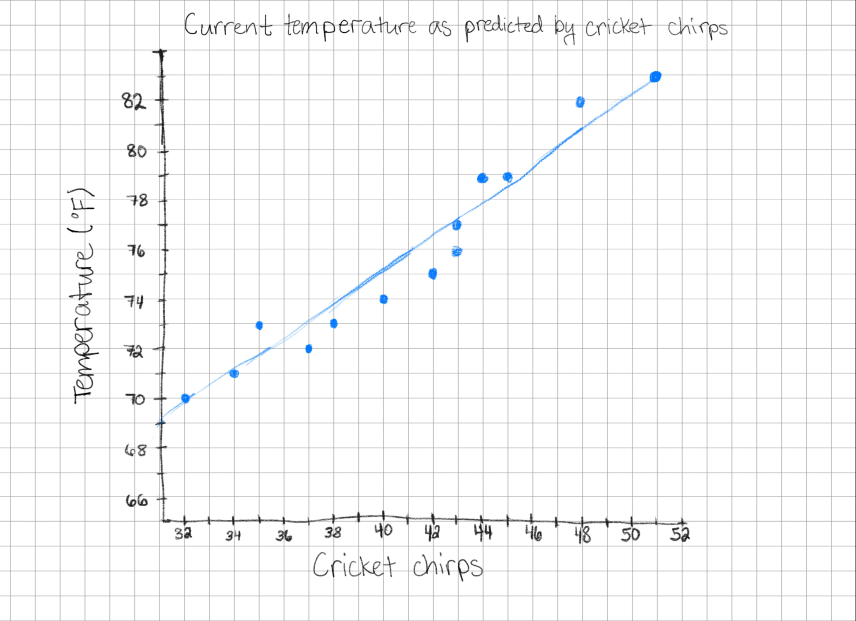
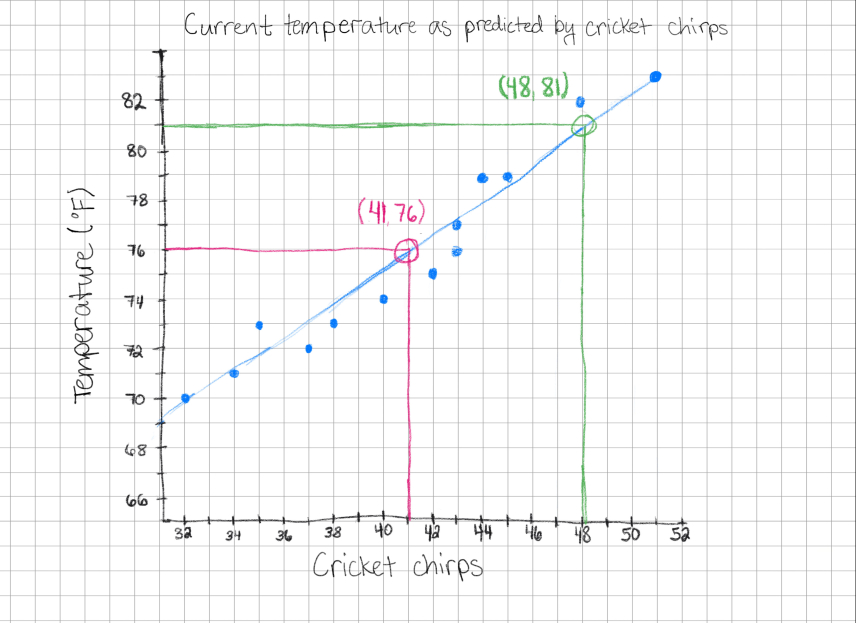
- Draw a straight line that touches as many points as possible — this is called the line of best fit.
Expand to see our hand drawn chart
- Now that we have a line, we need to find the formula for that line, which will serve as your cricket thermometer, y= mx + b. We need to calculate the variables ‘m’ and ‘b.’ We will start with ‘m,’ or the slope.
- The formula for slope is: m = (y2-y1) / (x2-x1)
- For x1 and y1:
- Pick any value for x that is on your graph. I picked 41.
- Draw a straight vertical line from 41 until you hit your line. Make a dot.
- Now, draw a straight horizontal line from that dot to the y-axis. Make a note of that value. For me it was 76. This is your y value.
- In this case, (x1,y1) is (41,76)
- We need to repeat this process to get x2 and y2
- I picked 48 and got 81 as my y value (48, 81)
Expand to follow along with the hand drawn example
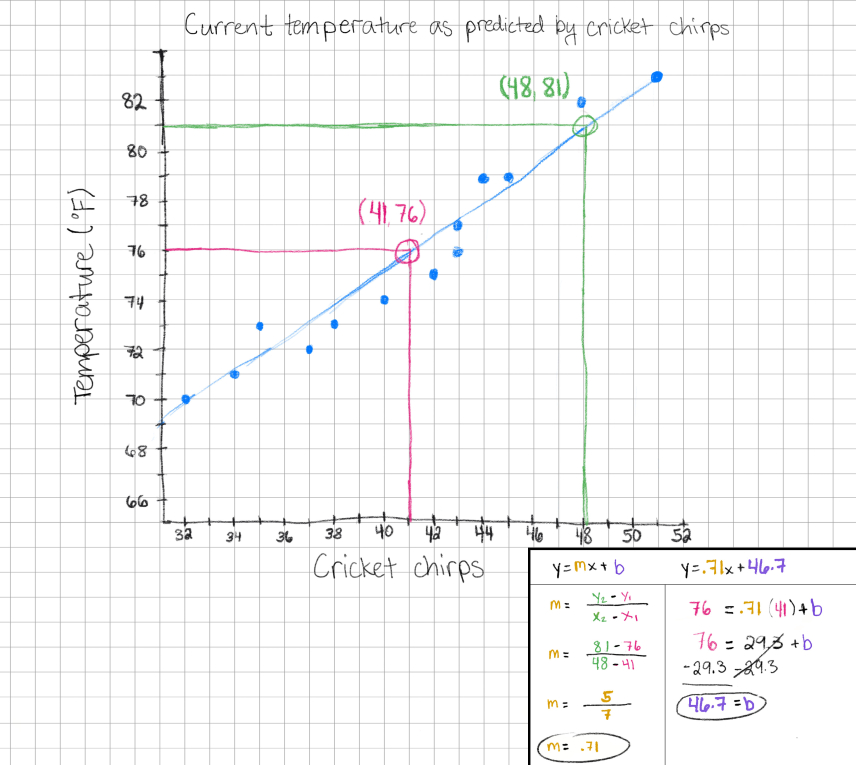
- If we insert those numbers in the formula using my example, we now have: m = (81 - 76) / (41 -48)
- Now, solve for m, which is the slope.
- m = 5 / 7
- m = .71
- Now that we have m, we can choose any value on the line, say (x1,y1) to calculate our last variable — ‘b’
- (41,76) is my (x1,y1)
- 76 = (.71 * 41) + b
- 76 = (29.3) + b
- 76 - 29.3 = b
- 46.7 = b
- Plugging in m and b … my cricket equation is: y = .71 * x + 46.7 or Current temperature (F) = .71 * cricket chirps in 15 seconds + 46.7
- I did not get the exact same formula by hand as I did in the spreadsheet, but that's okay, they are quite close.
It's no surprise that cricket chirps aren't the easiest way to measure the temperature, however, it is a pretty cool mental exercise that requires less equipment than even a thermometer — you just need your brain! So next time you want to share a piece of trivia or figure out whether you will need a jacket when you don’t have convenient access to the forecast, just remember to listen to your local cricket weather report.
For many people, opening their windows to a chorus of crickets is a hallmark of summer nights and fall mornings, but did you know that their symphony can also be used as a thermometer? By counting the frequency of their chirps, you can estimate the temperature with arithmetic!
Much like a sluggish bumble bee on a cool spring morning or a lizard sunning on a rock, crickets move slower in cooler temperatures. This is because each of these animals is an ectotherm — their body temperature depends on the temperature of their environment. As crickets warm, they can rub their wings together faster, which is how male crickets make the nightly repetitive chirp they use to attract mates.
The relationship between cricket chirping and temperature has been noted for a long time. In Western science, it is called Dolbear’s law after the most widely referenced early publication on the phenomenon published in 1897 by Amos Dolbear. His observations showed that you can count the number of chirps per 15 seconds, add 40, and that will give you the temperature in Fahrenheit (F).
Dolbear's law
Temperature (F) = number of cricket chirps in 15 seconds + 40
The El Paso, Texas Weather Forecast Office makes calculating the temperature even easier by providing a cricket chirp converter based on Dolbear’s law! Just plug in the number of chirps and it will convert the number to a temperature in degrees Fahrenheit, Celsius, or even in Kelvin (you do you!).
While using Dolbear’s law is a neat party trick, if you really want to impress your friends, figuring out the formula for the crickets in your own neighborhood can make your estimate even more accurate.
Different cricket species may work best with a different formula for temperature, or could be more or less accurate than another species. Dolbear didn't identify what species of cricket his formula referenced, but many people think that offsite link he counted the chirps of the snowy tree cricket, which is now nicknamed “the thermometer cricket,” for its accuracy as a thermometer. Factors like how close the crickets are to a warm building or what region you live in can impact the formula that best predicts temperature based on cricket chirps. One way to account for your unique situation is to calibrate your own cricket thermometer!
To do this, you’ll need to count cricket chirps at several different temperatures and record the results. Then you can plot the points on a graph and draw a line that goes through the most data points. Once that is done, you can calculate the best formula for predicting temperature using cricket chirps in your area. Follow along with our example on the next tab, either by hand or using a computer spreadsheet program!

Things to consider before you start
Before you hop into your experiment, there are a few things to think about beforehand.
- You can plan to do your experiment all in one day or over multiple days.
- In one day: Plan ahead by looking at your hourly temperature forecast at weather.gov. First, look up your forecast, then scroll down to “Additional forecasts and information,” and choose “hourly weather forecast” or “tabular weather forecast.” That way, you can begin at a time where the temperature will be dropping or rising.
- Over multiple days: Try to choose days with similar weather conditions. That way you reduce how varying conditions, like rain or drought, might affect cricket chirps.
Expand to see a screenshot of weather.gov

- Decide whether you are going to count crickets once at each temperature or multiple times. Or if you might have someone else join you and count separately to make sure you both get the same result.
- Often scientists take more than one measurement to make sure they get a precise result.
- By having someone else count at the same time, you may have greater accuracy. Read more about accuracy and precision in science.
Step 1: Observe
The first thing you will need to do is decide which cricket chorus you want to count — often multiple groups are calling at once. For example, you may hear two groups, one far away and one close. Or, perhaps there are multiple species of crickets, one group singing high like the sopranos in a choir and another that sings a lower note. The scientist in you may be thinking that counting the same individual cricket’s chirps would be more precise, but listening to a single cricket is often hard since groups tend to synchronize.
- Listen to the choruses of crickets around you. Can you pick out different groups of crickets singing?
- Once you feel confident that you can pick out the different groups of crickets, choose one of them to count for your thermometer.
Tip
Record your decision so you remember if you take a break or want to repeat your experiment later. Here is my example: Date: 7/28/22. Time: 8:00pm. I heard 2 groups of crickets, one high and one low. I am going to listen to the high-pitched group of crickets because they are the easiest for me to count.
Step 2: Record
Now that you’ve identified your chosen chorus, you’ll need to make a data table and collect your data.
- First, make a data table by hand or in a spreadsheet program on a computer. Put the following columns in your data table: Date, time, current temperature, cricket chirp count, notes (see photo below for our data table).
- When you are ready to begin your first count, record the date and time in the appropriate columns in the table. Then, look up the current temperature or, if you have an outdoor thermometer nearby, you can use that to record the temperature.
- Now, set a timer for 15 seconds and count the number of chirps you hear from your chosen group of crickets.
Tip
If you have a mobile device handy, you can try staying silent and recording for 15 seconds and writing the data in your table later.
Step 3: Repeat
To calibrate your cricket thermometer, you will need to repeat step 2 at multiple different temperatures. Otherwise, all you would know is how often crickets chirp in that specific moment!
- We recommend recording cricket chirps for at least 10 unique temperatures.
- Choose clear weather for nights that you count crickets; that way, you eliminate the possibility of precipitation affecting your results.
Tip
Take notes about weather conditions in your “notes” column. You could also record things like whether there is a lot of background noise from traffic or other animals, for example. If anything completely interrupts your count, like a car driving by or someone talking loudly, make sure to start over.
Our data table
Step 4: Calculate
Now for the fun part — plot your data and calculate your cricket thermometer equation! You can do this part either by hand or in a spreadsheet program. Follow along with whichever method you prefer.
In both examples, we are plotting data and drawing a line of best fit, or a line that goes through the most of our data points. Then, we find the formula for that line, which also serves as the cricket thermometer formula. The formula for a line is y = mx +b, where:
- 'm' is the slope
- 'b' is the y-intercept
- 'x' and 'y' are coordinates for a point along the line. In our case, x is the number of cricket chirps and y is the temperature.
So, you can read the formula as: Temperature = number of cricket chirps in 15 seconds * m + b
Now, onto finding your slope (m) and y-intercept (b)!
In a spreadsheet program
For this example, we are using Google Sheets, but other spreadsheet programs, such as Microsoft Excel, can also be used.
- Enter your data into the spreadsheet
- Select your “current temperature” and “cricket chirp” columns
- Go to the “Insert” menu and select “chart”
Expand to see screenshot of inserting a chart

- Double-click on your chart. The chart editor sidebar will open.
- In the “setup” menu (shown on the left in the image below):
- For chart type, select “scatter”
- Set chirps as the x-axis and temperature as the series
- In the “customize” menu (shown on the right in the image below):
- Select “series” and check the “add trendline” box
- Trendline type should be linear
- In the “label” dropdown, select “equation”
- Select “series” and check the “add trendline” box
- In the “setup” menu (shown on the left in the image below):
Expand to see screenshot of the chart editor

The equation at the top of the chart is your cricket thermometer! You can put any number of cricket chirps in place of the “x” and find the temperature.
By hand
If you don’t have access to a computer, you can do this calculation by hand, but it is a bit more work! Follow the instructions below. These instructions assume some graph-making experience, so If you aren’t very familiar with making graphs and plotting data, make sure to work with someone who can help you.
- First draw your X and Y axes.
- Your X and Y axes should start with a number a few below your lowest measurement (this will make later steps easier).
- Make sure your axes go up by the same interval between each mark, for example label every number or every other number.
- Then plot your data.
- Draw a straight line that touches as many points as possible — this is called the line of best fit.
Expand to see our hand drawn chart

- Now that we have a line, we need to find the formula for that line, which will serve as your cricket thermometer, y= mx + b. We need to calculate the variables ‘m’ and ‘b.’ We will start with ‘m,’ or the slope.
- The formula for slope is: m = (y2-y1) / (x2-x1)
- For x1 and y1:
- Pick any value for x that is on your graph. I picked 41.
- Draw a straight vertical line from 41 until you hit your line. Make a dot.
- Now, draw a straight horizontal line from that dot to the y-axis. Make a note of that value. For me it was 76. This is your y value.
- In this case, (x1,y1) is (41,76)
- We need to repeat this process to get x2 and y2
- I picked 48 and got 81 as my y value (48, 81)
Expand to follow along with the hand drawn example

- If we insert those numbers in the formula using my example, we now have: m = (81 - 76) / (41 -48)
- Now, solve for m, which is the slope.
- m = 5 / 7
- m = .71
- Now that we have m, we can choose any value on the line, say (x1,y1) to calculate our last variable — ‘b’
- (41,76) is my (x1,y1)
- 76 = (.71 * 41) + b
- 76 = (29.3) + b
- 76 - 29.3 = b
- 46.7 = b
- Plugging in m and b … my cricket equation is: y = .71 * x + 46.7 or Current temperature (F) = .71 * cricket chirps in 15 seconds + 46.7
- I did not get the exact same formula by hand as I did in the spreadsheet, but that's okay, they are quite close.

It's no surprise that cricket chirps aren't the easiest way to measure the temperature, however, it is a pretty cool mental exercise that requires less equipment than even a thermometer — you just need your brain! So next time you want to share a piece of trivia or figure out whether you will need a jacket when you don’t have convenient access to the forecast, just remember to listen to your local cricket weather report.


