Jeremy Hoffman, Ph.D., reflects on the origins of this growing community science movement
On one of the hottest days of 2017, a group of community volunteers took to the streets of Richmond, Virginia, with temperature sensors mounted on their cars and bicycles. As part of the first urban heat island community science mapping campaign of its type, they recorded temperatures throughout the entire city, and the information they collected helped generate detailed maps that revealed which neighborhoods were hottest and coolest. Since then, more than 60 communities across the United States have followed this model, leading their own mapping campaigns and using the information to make their cities more resilient and equitable in the face of extreme heat.

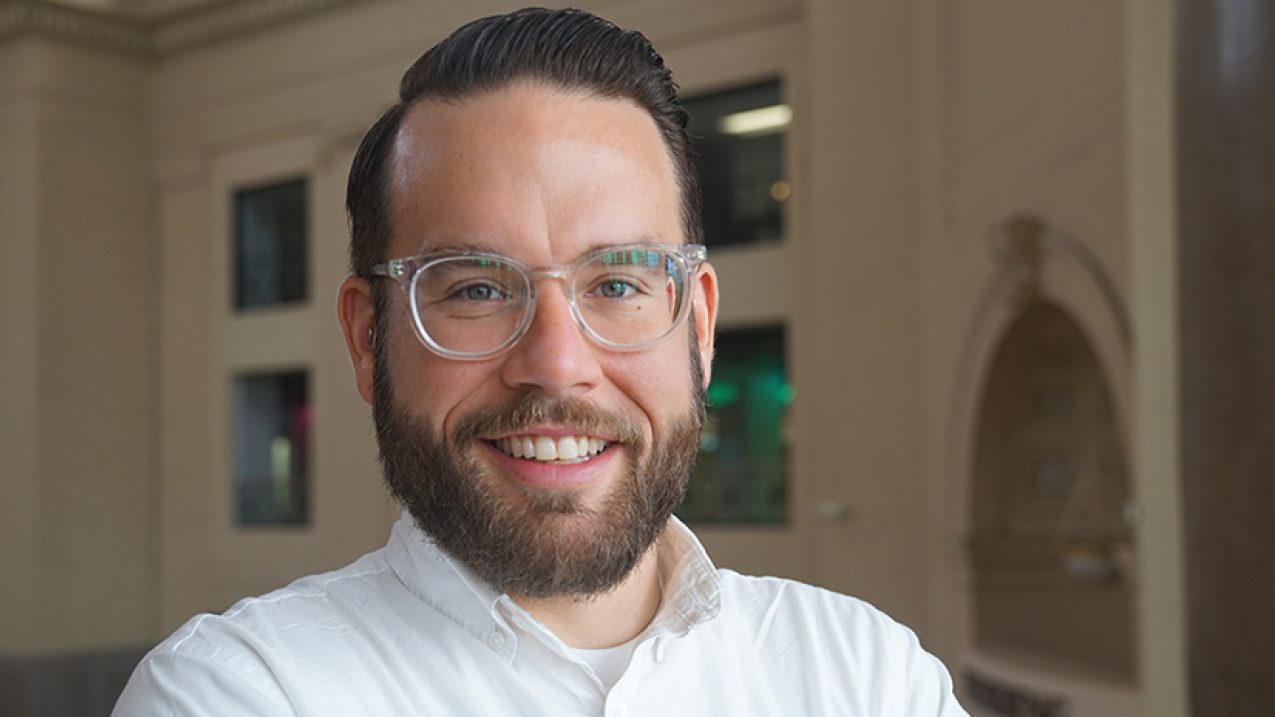
Jeremy Hoffman, Ph.D., is the David and Jane Cohn Scientist at the Science Museum of Virginia and co-creator of the urban heat island mapping project. (Image credit: Science Museum of Virginia)
This urban heat island mapping campaign was led by the Science Museum of Virginia offsite link with a grant from NOAA’s Environmental Literacy Program. It focused on quantifying the urban heat island effect, in which highly developed urban areas can experience afternoon temperatures that are 15 to 20 degrees Fahrenheit hotter than other parts of the city, while engaging residents and empowering community organizations to use the information to make their cities safer in the face of climate change.
“NOAA’s Environmental Literacy Program supports projects that get community members involved in understanding the threats their community faces and taking action to address them,” said Carrie McDougall, Ph.D., co-lead of the Environmental Literacy Program. “The urban heat island mapping campaign demonstrated the power of community members getting involved in local resilience issues.”
We caught up with Jeremy Hoffman, Ph.D., the David and Jane Cohn Scientist offsite link at the Science Museum of Virginia and co-creator of the urban heat island mapping project, to reflect on how the effort has grown.
1. What was the inspiration for this project? How did you and your team come up with this idea, and who was involved?
The inspiration for this project came out of conversations that Vivek Shandas offsite link, professor at Portland State University, and I had over breakfast in Portland, Oregon, in 2016. Vivek and his team had developed a way to integrate vehicle-based observations of air temperature with satellite-based observations of land cover, enabling them to create highly detailed descriptive models of heat variation based on a relatively easy-to-perform observation method. We talked about how bridging his scientific methodology with a community science approach might not only be interesting from a scientific perspective — his method had not yet been applied in a humid, Southeastern city — but also from the public engagement perspective, as his methodology was easy to follow and replicable between locations. To us, this meant that we could potentially train community members to be the scientists that executed the campaign.
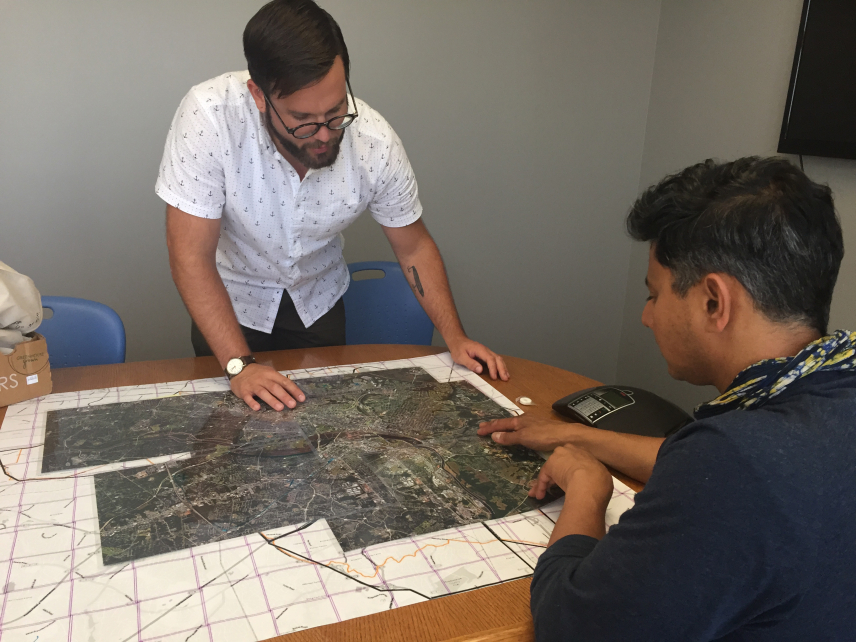
Once we had the idea, it was time to gather support, so I began to cold-call nonprofits working in green infrastructure and teen development and city departments that were doing climate-relevant work like the City of Richmond Office of Sustainability. I also reached out to faculty at the local universities to see if they'd be interested in recruiting students and joining in. The last piece was asking local meteorologists if they'd like to come in, too. All told, I think we had nine different organizations at the table for decision-making around where we'd go to measure temperatures around Richmond.
2. How did the first campaign go? What lessons did you learn?
The first campaign still feels like lightning in a bottle, in many ways. We were fortunate to have nearly perfect meteorological conditions for monitoring an extreme heat event in Richmond and had a full complement of community scientists from our collaborative partnership. However, we learned a lot from the experience — namely, inviting the media to join us on ride-alongs and follow us in the cars was a hugely impactful way to rapidly get our story out into the community beyond our partnership organizations.
Our campaigns are extremely charismatic — local residents using science to understand a huge threat to public health and infrastructure, coordinated among organizations that are all pulling in the same direction. We also learned a lot about what was useful to the community organizations after the fact — maps showing their data, maps showing how temperatures varied, quick statistics about our findings — all of these things help improve our approach to communicating the results in an aligned way.
We also learned that we should be compensating the community scientists in some way, either monetarily or through food and drinks throughout the day. A little goes a long way in showing your community scientists that they are valued partners in a coordinated effort to produce meaningful science.

3. How have communities used the results of these campaigns to make changes locally? Do you have any favorite examples?
The results of our 2017 campaign (and follow-up campaign in 2021) have been used in so many unique ways that it is hard to focus on any one as especially my favorite! Probably the biggest impact projects have been Mayor Stoney's commitment to five new parks in the city's southside citing these data and watching the local Chesapeake Bay Foundation marshal almost $1 million toward community-driven tree planting projects around community centers, faith centers, schools, and other public land using our data.
Other cities have used community science heat campaign data to guide decision-making for tree-planting campaigns, the location of new resilience hubs, and which streets will be covered in light-reflecting coatings to lower their temperature. I have been so moved by how these data have impacted so many communities, and that number continues to grow every summer.
4. Can you reflect on how the model has grown? What does it feel like to see your campaign model inspire new communities to investigate heat in their areas?
I have to give a lot of credit to David Herring, Director of Communication and Education in NOAA's Climate Program Office, for supporting me and Vivek so much in the years following the 2017 Richmond campaign. He helped us scale up the campaign to what you see today. Vivek also took on forming a limited liability company in the process, helping to streamline how financing these campaigns worked.
I really am so proud to have been able to have a hand in developing this model and getting to watch it spread to new communities. Now that I'm a bit "outside" of the campaign directing, it's fun to get people who send me the news media about other cities' campaigns and say: "Hey, have you heard of this?" I just have to smile and nod, "Yes, I have heard of these campaigns." I really look forward to seeing it grow internationally now, too. I'm honored to have had any sort of role in it.
5. Is there anything you’d like to say to the volunteers who participate in urban heat island mapping campaigns?
Congratulations! You are using science to help increase your community's resilience in the face of climate change. Now the decision you have in front of you is this: what are you going to do next with this information you helped produce?


