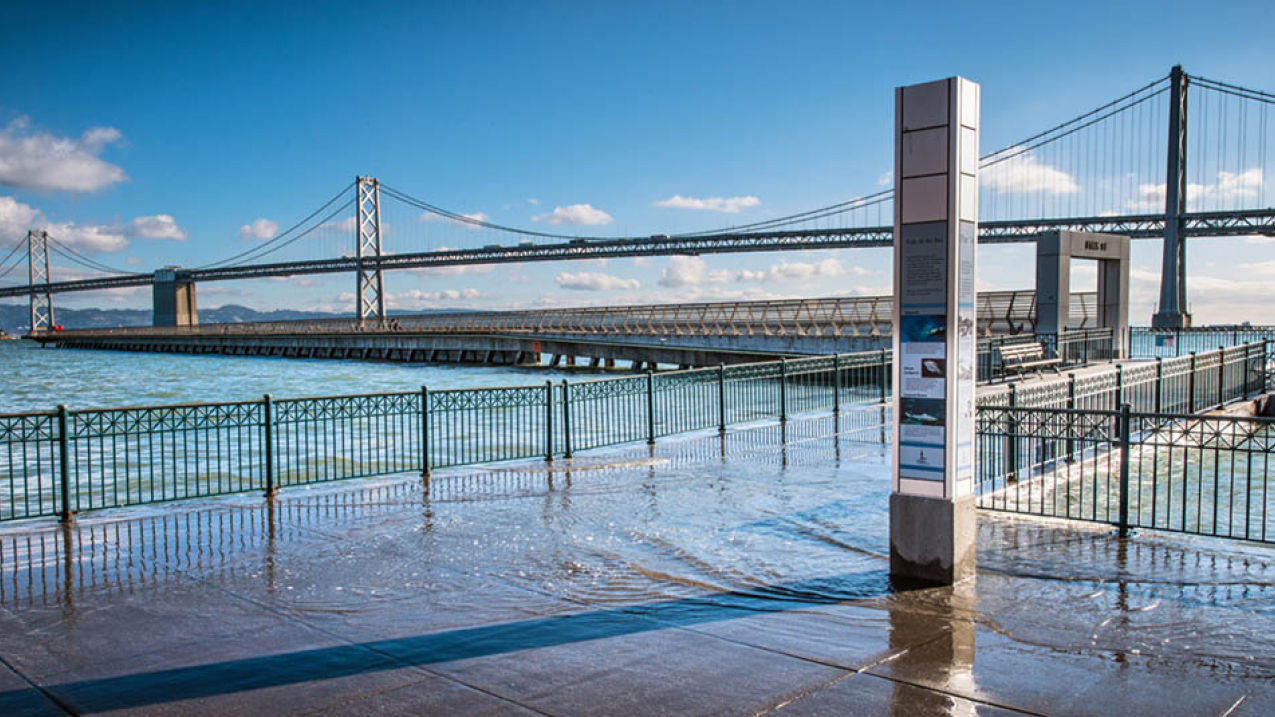
Californians living on the coast may be used to seeing so-called "King Tides," a regular phenomenon where high tides are higher than normal on certain days of the year. Shown here: Embarcadero Waterfront in San Francisco, California (Image credit: NOAA)
Tracking sea level rise ... and fall
What is sea level?
Is sea level changing?
Are changes in sea level related to climate change?
How do we measure sea level?
How can sea level changes affect me?
Sea level is a measure of the average height of the surface of the sea. Like land, the surface of the ocean is not flat or uniform. But unlike land – for the most part – it can change in short order.
The surface of our world’s ocean is a mosaic of peaks and valleys, hills and plains, resulting from the force of gravity, the Earth’s rotation and irregular features on the ocean floor. Other forces can raise or lower the water level too, such as temperature, wind, ocean currents, tides and movement of the land itself.
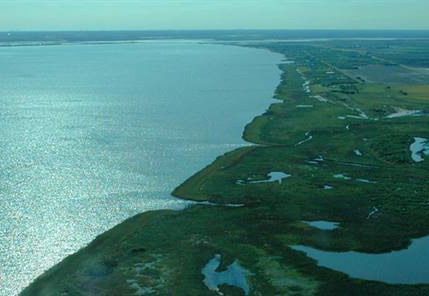
There are several terms used to describe sea level:
- Global sea level is the average height of the ocean around the world.
- Local sea level is the height of the water measured along the coast relative to a specific point on land.
- Mean sea level, also known as a tidal datum, is the average of the hourly water level heights observed at a local tide station over 19 years.
Understanding sea level and its terminology is important. Sea level data and tidal information establish marine boundaries, from private property lines to the borders of our nation’s territorial sea. NOAA uses sea level data to produce nautical charts and promote safe navigation. Sea level information also informs how we develop safe building codes, restore coastal habitats and site infrastructure. Together with storm surge information, it also informs floodplain maps and safe evacuation routes. With 40 percent of Americans living in densly populated coastal areas, having a clear understanding of sea level trends is critical to our societal and economic well being.
Sea level is changing at an increasing rate.
Global sea level has been rising over the past century, and we’ve seen the rate increase in recent decades. Global tidal records from 1900 to 1990 show an estimated 4- to 5-inch rise in global mean sea level. Then, in the 25 years from 1990 to 2015, this global tide gauge network showed global sea level rising 3 inches, agreeing with measures by satellite altimeters taken since 1992. Currently, sea level is rising about one-eighth of an inch per year but is projected to rise in the future. By 2100, sea levels may rise another 1 to 8 feet – that’s feet, not inches.
Global sea level rise has two major causes:
- the expansion of ocean water as it warms.
- increased melting of land-based ice, such as glaciers and ice sheets.
Local sea level changes may be more or less than the global average, based on local conditions. The ocean is not like a bathtub where the water level rises and falls the same everywhere. Local factors affect the rate of sea level change, and they can be grouped into three categories:
- Changes in land elevation, such as subsidence resulting from sediment compaction or extraction of ground water and fossil fuels, and glacial isostatic adjustment where the land continues to rebound after the last ice age.
- Changes in gravitational forces, such as when mountain glaciers, ice caps and ice sheets in Greenland and Antarctica melt. They transfer the mass of their water to the ocean. As these areas lose their mass, their gravitational pull on the ocean weakens. Sea level in close proximity drops and rises further away as water flows from where it was once held.
- Changes in ocean circulation, such as when ocean currents are driven by the force of the wind and the different densities of water masses, based on their temperature and salinity. Locally, changes in these currents can cause more water to build up next to the land, raising sea level.
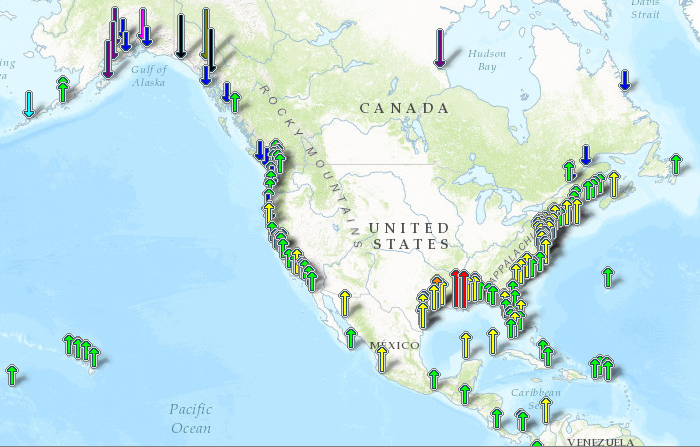
In the Gulf of Mexico and Mid-Atlantic, local factors, such as land subsistence, are adding to the global rate and speeding up local sea level rise. In Alaska and some parts of the Pacific Northwest, local sea level is falling as local factors, such as the land rebounding from the last glaciation, overshadow the overall global trend.
The majority of scientists agree that global sea level change is directly related to a changing climate.
Global sea level is rising from two primary causes: the expansion of ocean water as it warms; and increased melting of land-based ice, like glaciers and ice sheets in Greenland and Antarctica and other “upland” areas.
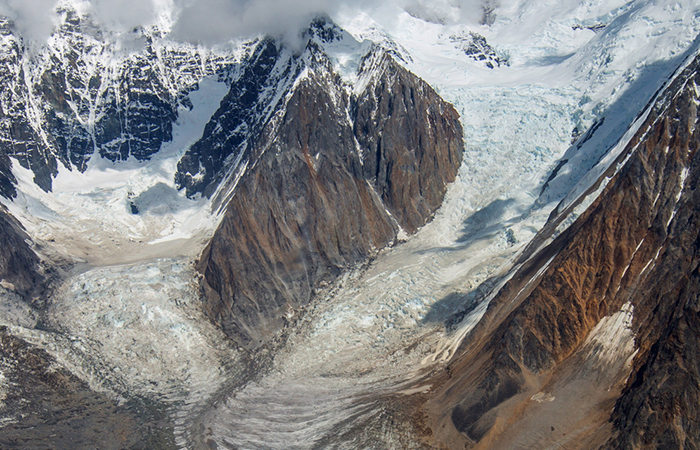
As the ocean and the atmosphere continue to warm, water levels will continue to rise. How much depends mostly on the amount of heat-trapping greenhouse gases, including carbon dioxide, emitted into the atmosphere and the subsequent warming. How fast depends mostly on the rate of glacier and ice sheet melting.
From the 1970s through the early 2000s, melting ice and the ocean’s expansion contributed equally to the observed sea level rise. Over the past decade, the amount of sea level rise due to land-based ice melting has almost doubled that of ocean expansion.
Scientists determined their relative contributions by taking many measurements. Moored and drifting buoys, satellites and water samples collected by ships show increases in sea surface temperature that cause ocean expansion. Determining the contribution of land-based ice melting takes many steps. Scientists measure the melt rate and elevation of glaciers during field studies to get one piece of the puzzle. The other important piece is satellite-based measurements of tiny shifts in Earth’s gravitational field at specific locations. Scientists can estimate the amount of water added to the ocean by tracking these shifts as melting ice transfers mass from land to sea.
Sea level is primarily measured using tide stations and satellite laser altimeters. Tide stations around the globe tell us what is happening at a local level – the height of the water as measured along the coast relative to a specific point on land. Satellite measurements provide us with the average height of the entire ocean. Taken together, these tools tell us how our ocean sea levels are changing over time.
Water level gauges: NOAA’s Center for Operational Oceanographic Products and Services has been measuring sea level for more than 150 years. The water level stations of the National Water Level Observation Network operate on the Atlantic, Pacific and Gulf coasts and the Great Lakes. On the coasts, we've computed changes in Mean Sea Level at 142 long-term water level stations using at least 30 years of observations at each location. From these observations, we’ve also been able to calculate mean sea level trends relative to a fixed place on land.
Using at least 30 years of observations from 142 long-term water level stations NOAA has calculated mean sea level trends relative to a fixed place on land.
Satellites: NOAA has used satellite laser altimeters, like those on GOES-16, NOAA’s newest next-generation weather satellite, to record the global sea level trend since 1992. The altimeters determine the height of the sea surface by measuring the return speed and intensity of laser pulses. NOAA's Laboratory for Satellite Altimetry provides the latest global sea level trend data, along with maps of the regional variation in the trend.
Sea level is not all the same across the ocean. For example, the absolute water level is higher in the middle of the ocean than it is along the coasts, due to winds and how ocean water circulates. Slowing ocean circulations, due to seasonal and weather patterns, make coastal sea levels rise.
Measurements of sea level matter on land, too. Using complex math and gravity readings, surveyors extend these lines through the continents and create datums. Vertical datums are used to measure surface elevations with high accuracy, showing how high above sea level a location is.
Counties along the U.S. coast host 40 percent of our population, provide jobs for 54 million people and produce $7.6 trillion in goods and services each year.
Rising seas threaten the infrastructure necessary for these local jobs and regional industries. They also put life and personal property at risk and threaten many important habitats for fish, wildlife, and plants.
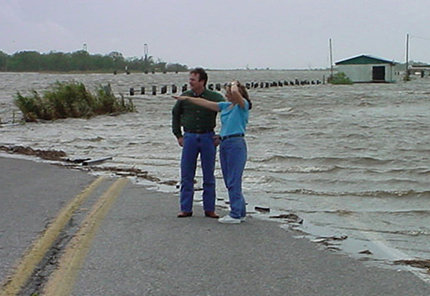
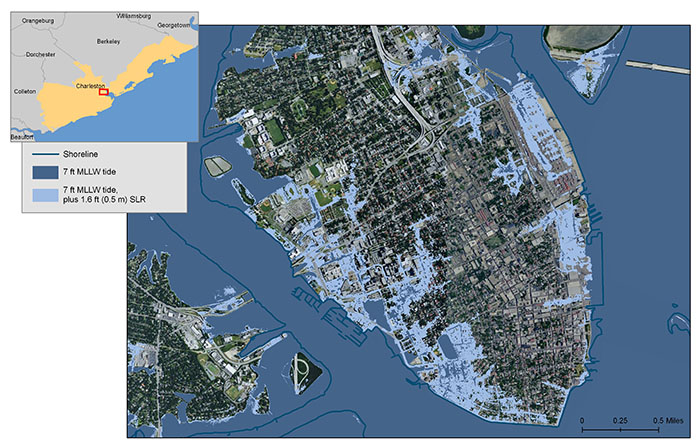
Sea level rise plays a role in coastal flooding, shoreline erosion, and hazards from storms. In many coastal locations, nuisance flooding is now three to nine times more frequent than it was 50 years ago. Major population centers along the Atlantic and Gulf coasts lie less than 10 feet above mean sea level, within the reach of strong storm surge events. Higher "background" water levels mean deadly and destructive storm surges push farther inland.
NOAA's role is to make the measurements and present the information to agencies and user groups that need it. Our science-based tools allow people to make informed decisions given the sea level changes we are seeing now and predict in the future. Future consequences from sea level rise depend on our current actions.
Sea level is a measure of the average height of the surface of the sea. Like land, the surface of the ocean is not flat or uniform. But unlike land – for the most part – it can change in short order.
The surface of our world’s ocean is a mosaic of peaks and valleys, hills and plains, resulting from the force of gravity, the Earth’s rotation and irregular features on the ocean floor. Other forces can raise or lower the water level too, such as temperature, wind, ocean currents, tides and movement of the land itself.

There are several terms used to describe sea level:
- Global sea level is the average height of the ocean around the world.
- Local sea level is the height of the water measured along the coast relative to a specific point on land.
- Mean sea level, also known as a tidal datum, is the average of the hourly water level heights observed at a local tide station over 19 years.
Understanding sea level and its terminology is important. Sea level data and tidal information establish marine boundaries, from private property lines to the borders of our nation’s territorial sea. NOAA uses sea level data to produce nautical charts and promote safe navigation. Sea level information also informs how we develop safe building codes, restore coastal habitats and site infrastructure. Together with storm surge information, it also informs floodplain maps and safe evacuation routes. With 40 percent of Americans living in densly populated coastal areas, having a clear understanding of sea level trends is critical to our societal and economic well being.
Sea level is changing at an increasing rate.
Global sea level has been rising over the past century, and we’ve seen the rate increase in recent decades. Global tidal records from 1900 to 1990 show an estimated 4- to 5-inch rise in global mean sea level. Then, in the 25 years from 1990 to 2015, this global tide gauge network showed global sea level rising 3 inches, agreeing with measures by satellite altimeters taken since 1992. Currently, sea level is rising about one-eighth of an inch per year but is projected to rise in the future. By 2100, sea levels may rise another 1 to 8 feet – that’s feet, not inches.
Global sea level rise has two major causes:
- the expansion of ocean water as it warms.
- increased melting of land-based ice, such as glaciers and ice sheets.

Local sea level changes may be more or less than the global average, based on local conditions. The ocean is not like a bathtub where the water level rises and falls the same everywhere. Local factors affect the rate of sea level change, and they can be grouped into three categories:
- Changes in land elevation, such as subsidence resulting from sediment compaction or extraction of ground water and fossil fuels, and glacial isostatic adjustment where the land continues to rebound after the last ice age.
- Changes in gravitational forces, such as when mountain glaciers, ice caps and ice sheets in Greenland and Antarctica melt. They transfer the mass of their water to the ocean. As these areas lose their mass, their gravitational pull on the ocean weakens. Sea level in close proximity drops and rises further away as water flows from where it was once held.
- Changes in ocean circulation, such as when ocean currents are driven by the force of the wind and the different densities of water masses, based on their temperature and salinity. Locally, changes in these currents can cause more water to build up next to the land, raising sea level.
In the Gulf of Mexico and Mid-Atlantic, local factors, such as land subsistence, are adding to the global rate and speeding up local sea level rise. In Alaska and some parts of the Pacific Northwest, local sea level is falling as local factors, such as the land rebounding from the last glaciation, overshadow the overall global trend.
The majority of scientists agree that global sea level change is directly related to a changing climate.
Global sea level is rising from two primary causes: the expansion of ocean water as it warms; and increased melting of land-based ice, like glaciers and ice sheets in Greenland and Antarctica and other “upland” areas.

As the ocean and the atmosphere continue to warm, water levels will continue to rise. How much depends mostly on the amount of heat-trapping greenhouse gases, including carbon dioxide, emitted into the atmosphere and the subsequent warming. How fast depends mostly on the rate of glacier and ice sheet melting.
From the 1970s through the early 2000s, melting ice and the ocean’s expansion contributed equally to the observed sea level rise. Over the past decade, the amount of sea level rise due to land-based ice melting has almost doubled that of ocean expansion.
Scientists determined their relative contributions by taking many measurements. Moored and drifting buoys, satellites and water samples collected by ships show increases in sea surface temperature that cause ocean expansion. Determining the contribution of land-based ice melting takes many steps. Scientists measure the melt rate and elevation of glaciers during field studies to get one piece of the puzzle. The other important piece is satellite-based measurements of tiny shifts in Earth’s gravitational field at specific locations. Scientists can estimate the amount of water added to the ocean by tracking these shifts as melting ice transfers mass from land to sea.
Sea level is primarily measured using tide stations and satellite laser altimeters. Tide stations around the globe tell us what is happening at a local level – the height of the water as measured along the coast relative to a specific point on land. Satellite measurements provide us with the average height of the entire ocean. Taken together, these tools tell us how our ocean sea levels are changing over time.
Water level gauges: NOAA’s Center for Operational Oceanographic Products and Services has been measuring sea level for more than 150 years. The water level stations of the National Water Level Observation Network operate on the Atlantic, Pacific and Gulf coasts and the Great Lakes. On the coasts, we've computed changes in Mean Sea Level at 142 long-term water level stations using at least 30 years of observations at each location. From these observations, we’ve also been able to calculate mean sea level trends relative to a fixed place on land.
Using at least 30 years of observations from 142 long-term water level stations NOAA has calculated mean sea level trends relative to a fixed place on land.

Satellites: NOAA has used satellite laser altimeters, like those on GOES-16, NOAA’s newest next-generation weather satellite, to record the global sea level trend since 1992. The altimeters determine the height of the sea surface by measuring the return speed and intensity of laser pulses. NOAA's Laboratory for Satellite Altimetry provides the latest global sea level trend data, along with maps of the regional variation in the trend.
Sea level is not all the same across the ocean. For example, the absolute water level is higher in the middle of the ocean than it is along the coasts, due to winds and how ocean water circulates. Slowing ocean circulations, due to seasonal and weather patterns, make coastal sea levels rise.
Measurements of sea level matter on land, too. Using complex math and gravity readings, surveyors extend these lines through the continents and create datums. Vertical datums are used to measure surface elevations with high accuracy, showing how high above sea level a location is.
Counties along the U.S. coast host 40 percent of our population, provide jobs for 54 million people and produce $7.6 trillion in goods and services each year.
Rising seas threaten the infrastructure necessary for these local jobs and regional industries. They also put life and personal property at risk and threaten many important habitats for fish, wildlife, and plants.

Sea level rise plays a role in coastal flooding, shoreline erosion, and hazards from storms. In many coastal locations, nuisance flooding is now three to nine times more frequent than it was 50 years ago. Major population centers along the Atlantic and Gulf coasts lie less than 10 feet above mean sea level, within the reach of strong storm surge events. Higher "background" water levels mean deadly and destructive storm surges push farther inland.
NOAA's role is to make the measurements and present the information to agencies and user groups that need it. Our science-based tools allow people to make informed decisions given the sea level changes we are seeing now and predict in the future. Future consequences from sea level rise depend on our current actions.

