New satellite data to bring more accurate and detailed predictions

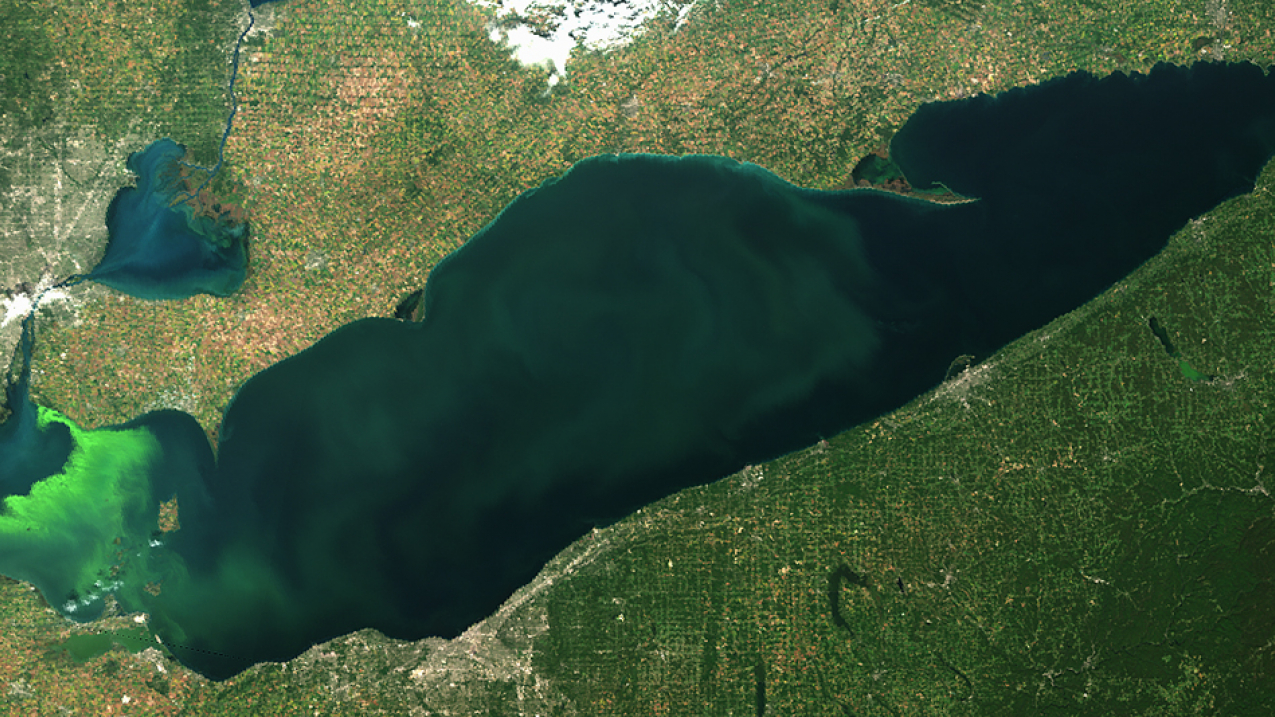
Satellite image of Lake Erie on September 23, 2017. The bright green areas show the peak of last year's algal bloom – this year's bloom is predicted to be smaller. (Image credit: NOAA derived image from Copernicus Sentinel-3a data from EUMETSAT)
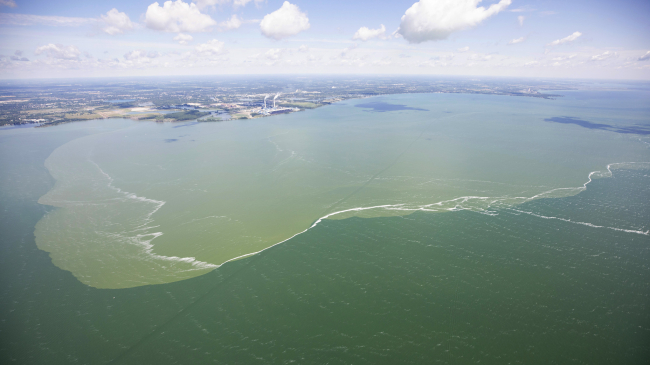
NOAA and its research partners predict that western Lake Erie will experience a harmful algal bloom (HAB) of cyanobacteria this summer that is smaller than in 2017 but larger than the mild bloom in 2016.
Scientists expect this year’s bloom to measure 6 on the severity index, but could range between 5 and 7.5. The severity index is based on a bloom’s biomass – the amount of its harmful algae – over a sustained period. The largest blooms, 2011 and 2015, were 10 and 10.5, respectively. Last year’s bloom had a severity of 8.
However, the size of a bloom is not necessarily an indication of how toxic it is. The toxins in a large bloom may not be as concentrated as in a smaller bloom. NOAA is developing tools to predict how toxic blooms will be.
“NOAA continues to develop tools that provide early warning systems for harmful algal blooms which help visitors and the community make better informed decisions about recreation activities," said W. Russell Callender, Ph.D., assistant NOAA administrator for the National Ocean Service. “The resources and services the lake provides drive our economy and we’ll keep working with our partners to bring the most accurate forecasts for the region.”
The Lake Erie forecast is part of a NOAA ecological forecasting initiative that aims to deliver accurate, relevant, timely and reliable ecological forecasts directly to coastal resource managers and the public. In addition to the seasonal forecast, NOAA also issues HAB bulletins twice a week during the bloom season, which provide a three- to five-day forecast.
This year, NOAA will increase use of the Sentinel-3a satellite data, which first became available last year. The satellite measures coastal water color, which shows the location of HABs, as part of the European Union’s Copernicus program, which just launched the sister satellite, Sentinel-3b that will start providing imagery by next summer. The Sentinel-3 series can see features 10 times smaller than has been seen in the HABs forecasts for the last several years. Sentinel-3 provides more detail to improve the forecasts used by the water treatment plants and public safety managers.
In recent years, visible blooms have not appeared until late July or early August. Microcystis, the cyanobacteria that form the bloom, will typically start growing when water temperatures reach 65-70 degrees, usually in mid-June. This year, the western basin warmed almost two weeks earlier than usual, reaching 70 degrees the last week of May, leading to the appearance of a small bloom.
“This early start does not change the forecast severity, because the bloom is determined by the amount of phosphorus that goes into the water,” said Richard Stumpf, Ph.D., NOAA oceanographer. “Close attention to the weekly bulletins will be important through July and August to find the best places to enjoy the lake.”
“Research efforts across the state have helped our communities prepare for blooms of this size, from developing new technologies to keep toxins out of our drinking water to assessing the human health impacts of harmful algal bloom toxins,” said Christopher Winslow, Ph.D., director of the Ohio Sea Grant College Program. “While continued efforts are still needed to reduce nutrient runoff and therefore the size of future HABs, Lake Erie residents and visitors will still be able to safely enjoy much of the lake during bloom season.”
Nutrient load data for the forecast came from Heidelberg University. The forecast models are run by NOAA’s National Centers for Coastal Ocean Science, the University of Michigan, North Carolina State University, LimnoTech, Stanford University, and the Carnegie Institution for Science. Field observations used for monitoring and modeling are done in partnership with NOAA’s Ohio River Forecast Center, NOAA’s National Centers for Coastal Ocean Science, NOAA’s Great Lakes Environmental Research Laboratory, NOAA’s Cooperative Institute for Great Lakes Research offsite link, Ohio State University’s Sea Grant Program offsite link and Stone Laboratory offsite link, University of Toledo offsite link, Bowling Green State University offsite link, and Ohio EPA offsite link.
Media contacts
Keeley Belva, NOAA, 301-643-6463
Jill Jentes, Ohio Sea Grant, 614-937-0072


