
Overview
The outward extent of wind moving around a hurricane is rarely uniform. The size of this wind field is often skewed to the right side of the storm's forward progress. At the same time, the size of each tropical cyclone varies.
One hurricane, while it may not be very powerful, could have a large wind field and be called a "large" storm. Other storms could be very powerful but compact in size.
With tropical cyclones, the National Hurricane Center issues a forecast/advisory four times daily that, among other things, provides the extent of various wind fields. These distance values are divided into quadrants and provide the user with a guide to size and severity of storms.
| TOTAL TIME | 20 minutes |
|---|---|
| SUPPLIES | Four different colored pencils. |
| PRINTED/AV MATERIAL | (pdfs) Hurricane Bill Forecast/Advisory, 0-170 nm chart. Additional charts for different size storms: 0-100 nm chart, 1-250 nm chart |
| TEACHER PREPARATION | None |
| SAFETY FOCUS | Hurricane Damage Potential |
Procedure
Using information from Hurricane Bill's Forecast/Advisory...
- Fill in the information at the top of the 0-170 nm chart. Convert the forecast/advisory's date/UTC time to your local date/time (see the time conversion chart). Wind speed and distances are in knots and nautical miles respectively. Multiply these values by 1.15 to obtain the wind speeds in miles per hour and distance in statute miles.
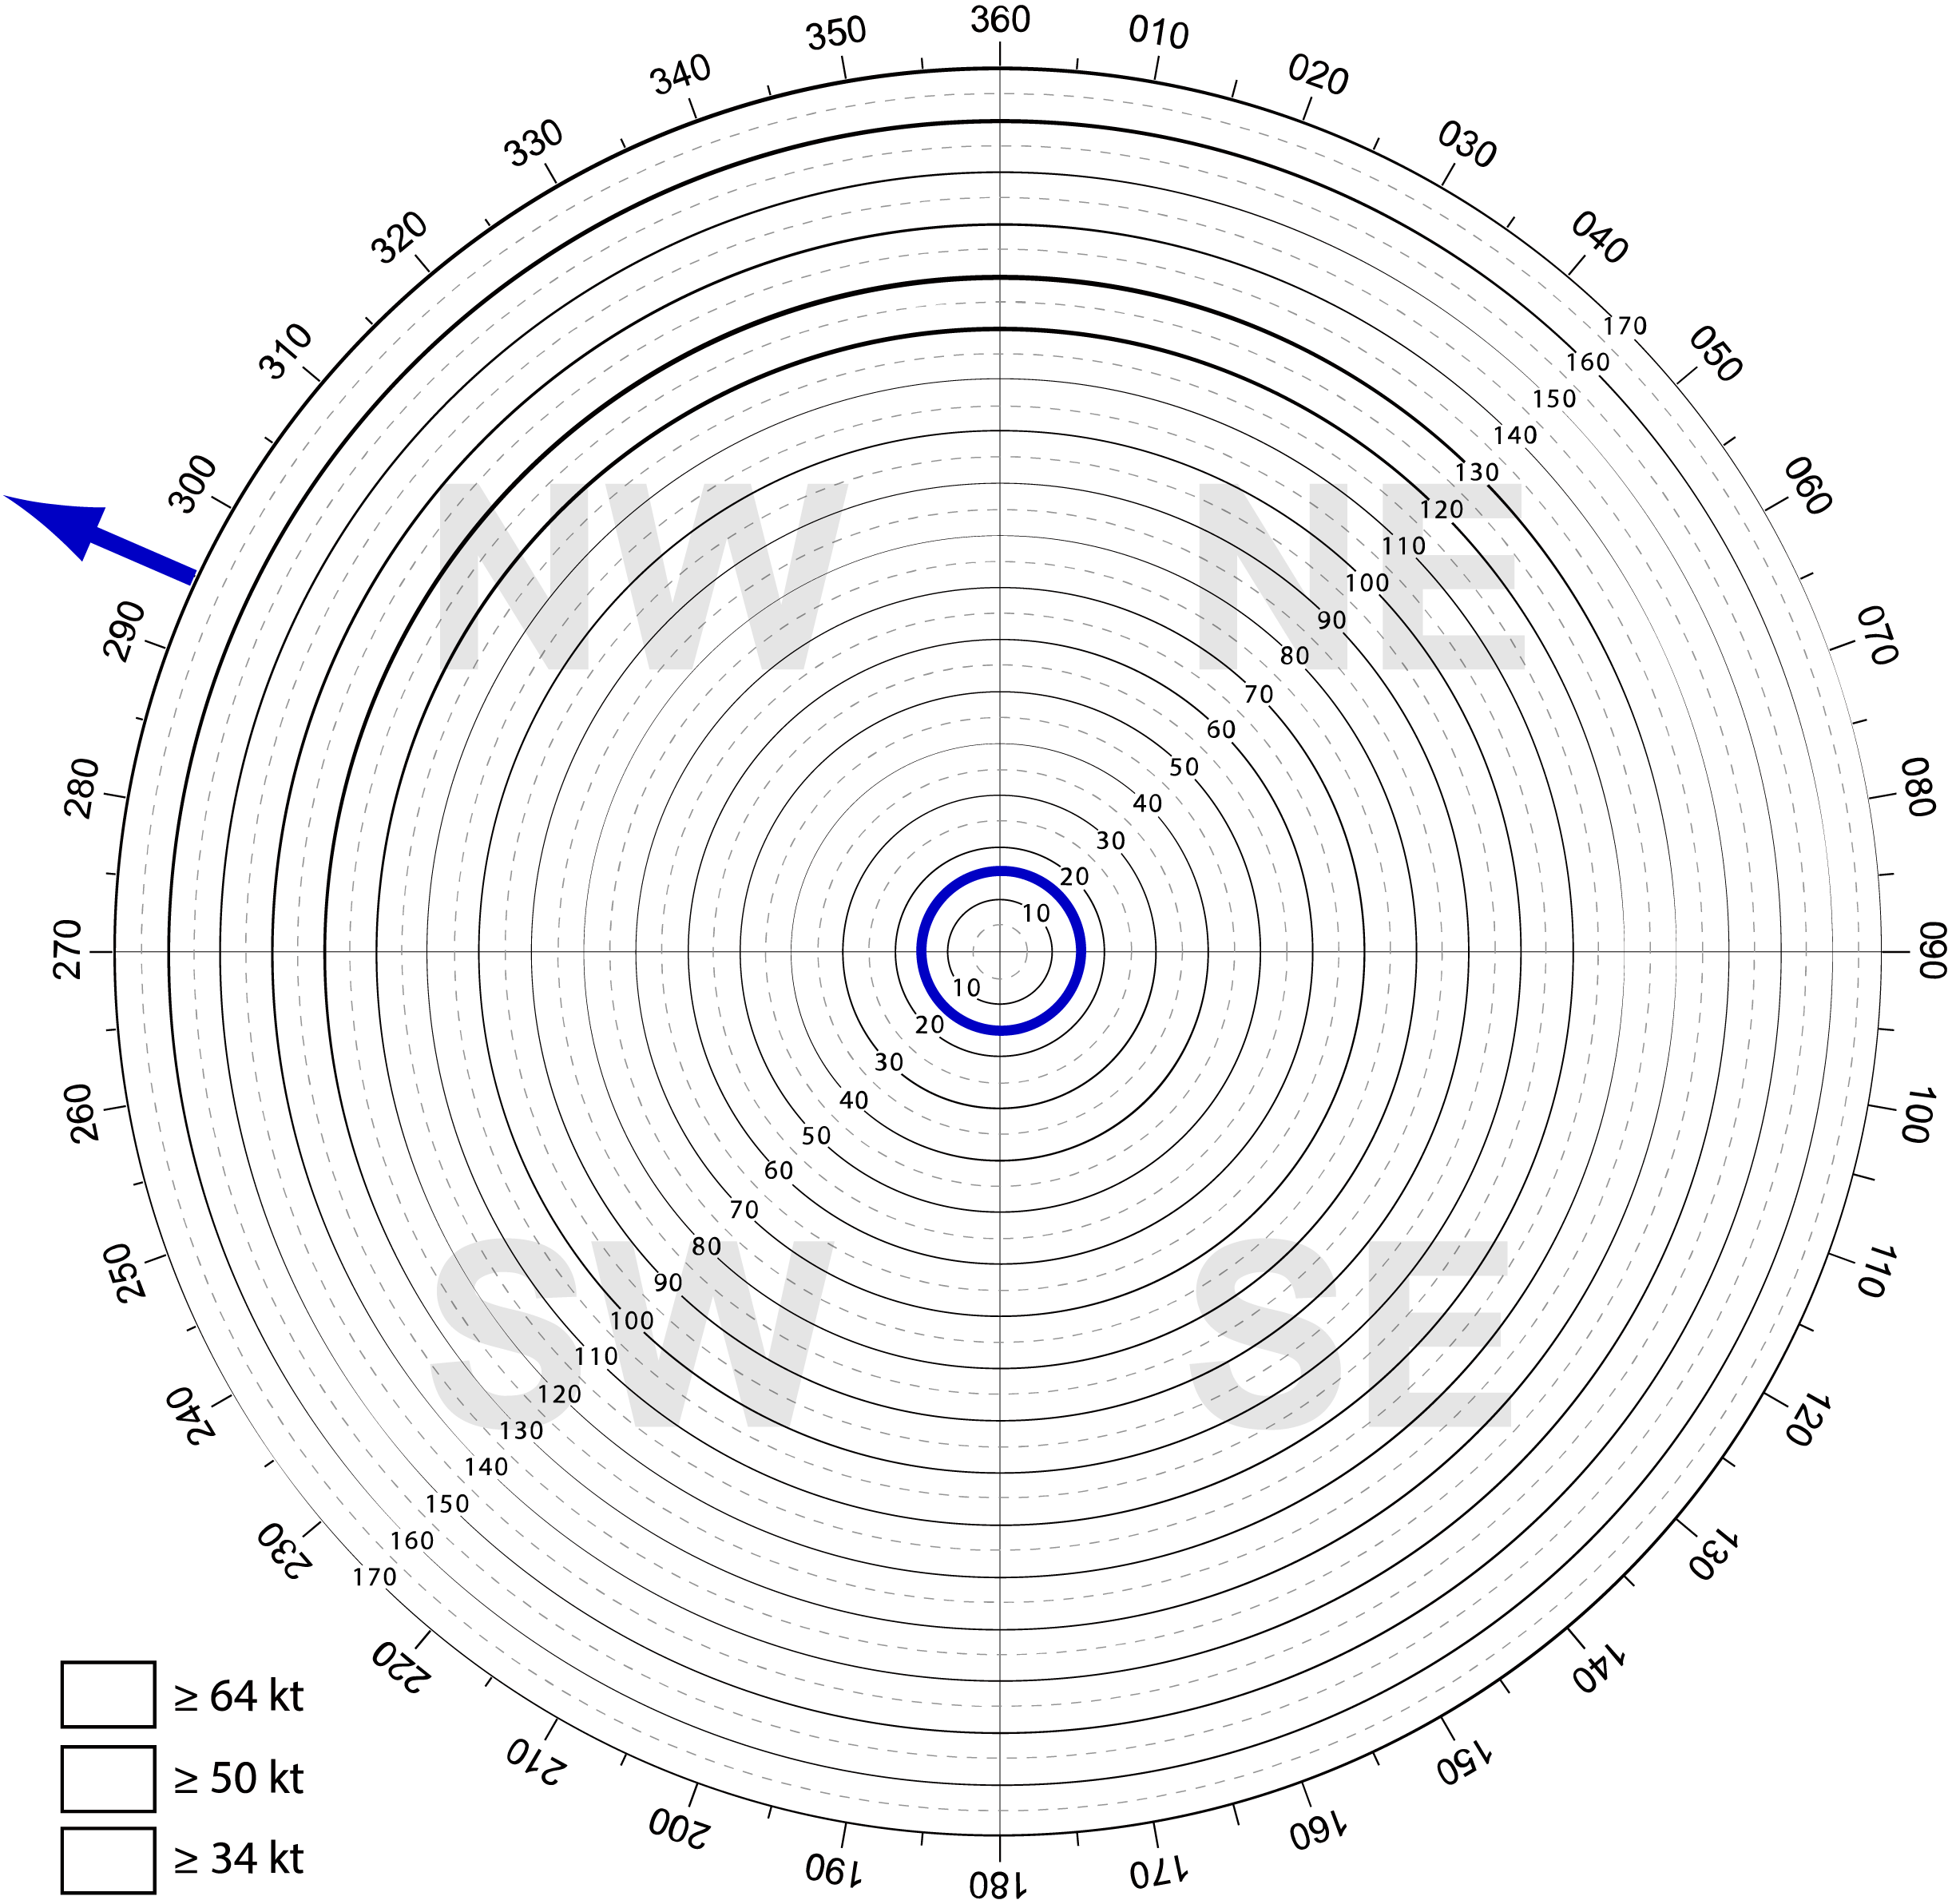
- Draw an arrow outward, perpendicular to the outside ring at 295°, indicating the storm's forward motion. Draw a ring around the center of the chart representing the size of Hurricane Bill's eye. Remember, the eye's size is reported as the diameter; divide the diameter in half to arrive at a radius of 15 nm. The ring will be along the dashed line located between the 10 and 20 nm. Your chart should look like this.
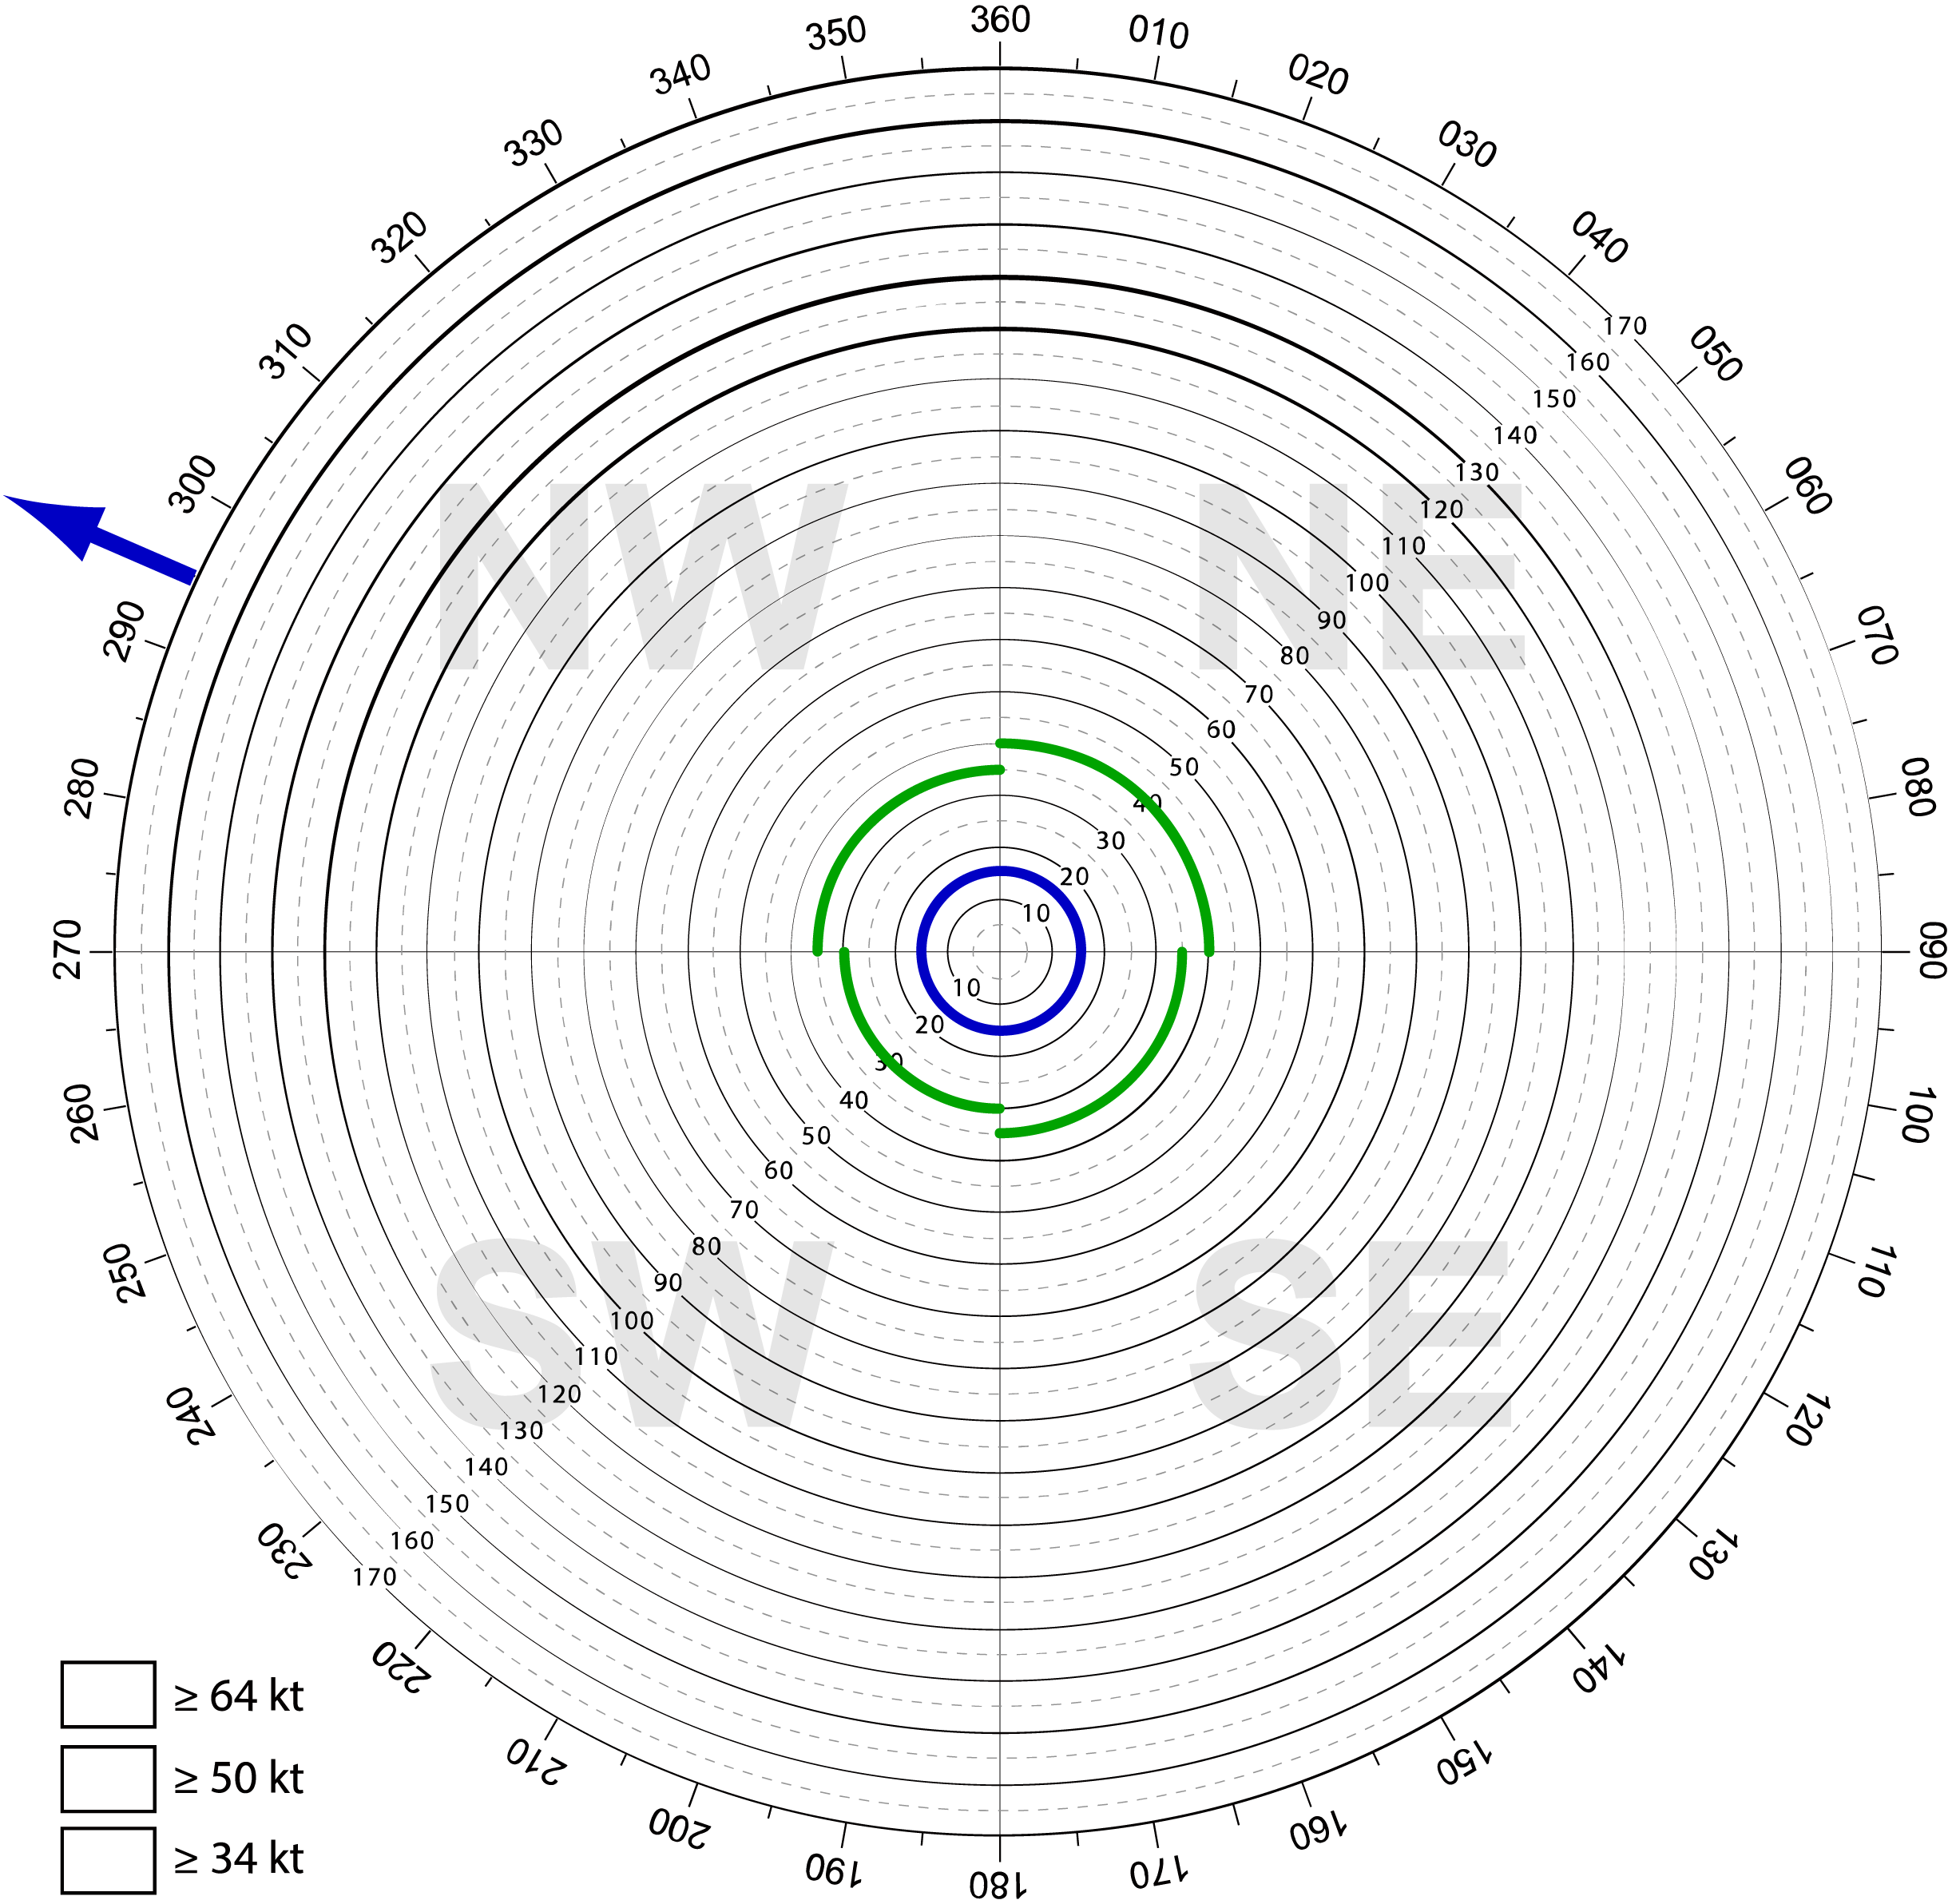
- Using a different color, from the 64 kt quadrant radii in the forecast/advisory, draw lines along the radius in each quadrant beginning in the northeast quadrant. Your chart should look like this.
- Connect the ends of each 'arc' by drawing along each radii. Shade the 64 kt shape. Your chart should look like this.
- Repeat previous two steps using the 50 kt radii values. Your chart should look like this.
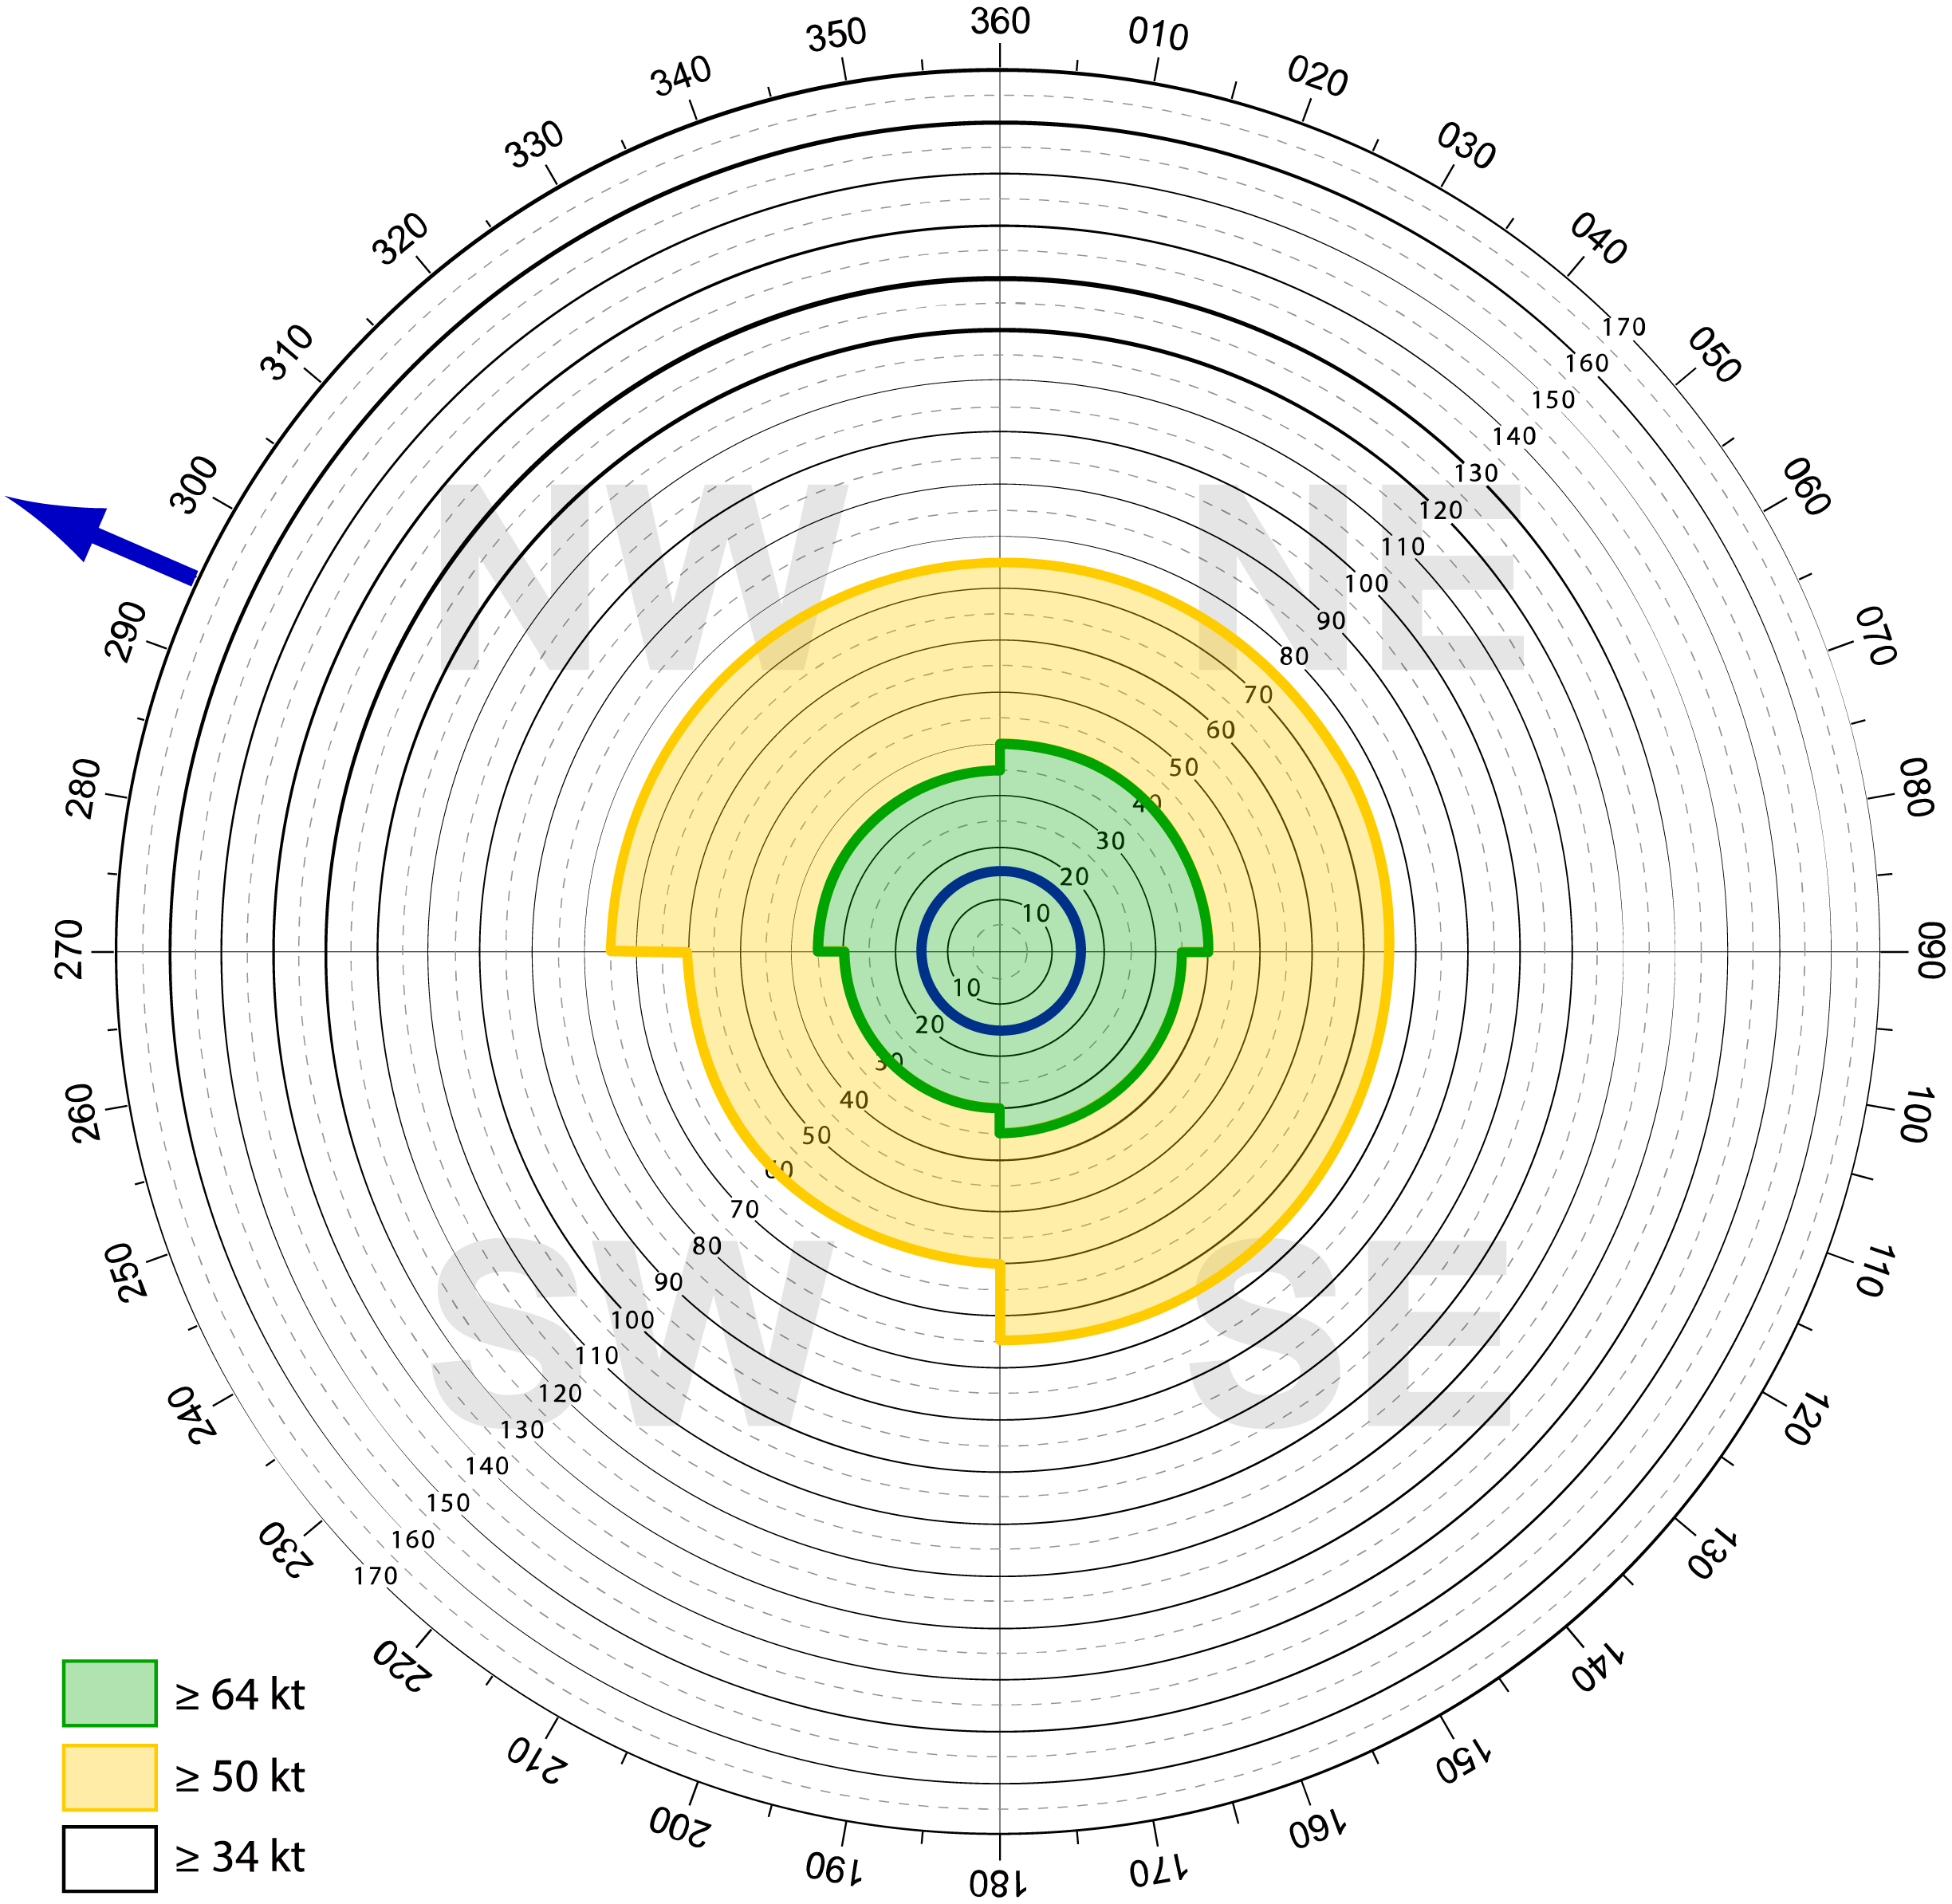
- Repeat again using the 34 kt radii values. Also, shade-in the key with the same colors used on the chart. Your chart should look like this.
Discussion
This wind "snippet" in the life of Hurricane Bill is typical of a tropical cyclone. The first thing to notice is which quadrant has the shortest extent of the wind field (SW quadrant).
Since the wind flows counter-clockwise around the eye, the wind flow in the southwest quadrant (in this case) is moving opposite the direction of the storms motion, resulting in a net decrease in wind strength.
Conversely, the northeast quadrant is where the largest extent of the wind field occurs. this is because the storm's forward motion by itself will create wind, which is added to the wind flowing around the storm itself. The strongest winds are nearly always on the right side of the storm's forward motion, often in the right-front quadrant relative to the storm's forward motion. Therefore, direction and speed of the storm's forward motion will impact the extent of the wind field in each quadrant.
The second thing to be aware of is that the wind is not automatically at the indicated strength at each point in each quadrant. These quadrants represent the regions of greatest extent of each wind. For example, in the northeast quadrant, 34 kt wind extends out to 150 nm.
There may (and probably will be) areas where the wind speed will be lower than 34 kt within that 150 nm. However, somewhere in that quadrant, 34 kt wind will be observed as far as 150 nm from the storm's center.
The third thing to notice is the rapid increase in wind speed as one approaches the storm's center. Using the northeast quadrant as an example, hurricane force winds (64 kt) extend 40 nm from the center.
The highest sustained winds (115 kt) do not occur within the storm's center but in the eye wall located at 15 nm from the center. Therefore, wind speed nearly doubles (from 64 kt to 115 kt) in just a short 25 nm as one moves toward the center of the storm.
This exercise can be repeated using one of the forecast points in the forecast/advisory and/or with different resolution charts.
Building a Weather-Ready Nation
Small increases in wind speed around a tropical cyclone can have huge increases in potential damage produced by the storm. This is the under-recognized danger of tropical cyclones.
In the exercise above, the near doubling of wind speed does not double the potential damage produced by the storm. Rather, it can produce up to 100 times the damage at 115 kt verses the damage produced at 64 kt.
The actual damage that occurs with any storm varies with the type of construction and the direction/duration of wind, among other factors. But the rapid increase in potential damage with small increases in strength should cause you to carefully consider moving to safe shelter should evacuation orders be given.