A new tool created by the Community Collaborative Rain, Hail, and Snow Network (CoCoRaHS offsite link) makes it easier than ever to visualize and explore precipitation data collected by volunteers across the United States (including Puerto Rico, the U.S. Virgin Islands, and Guam), Canada, and the Bahamas.
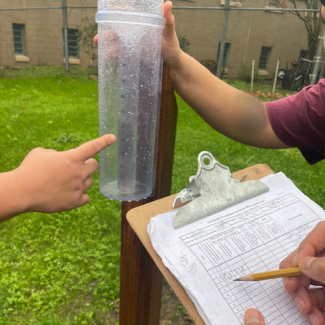
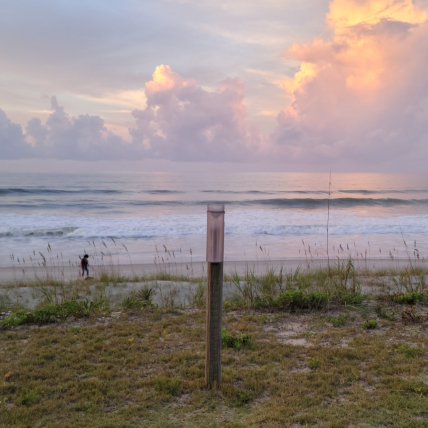
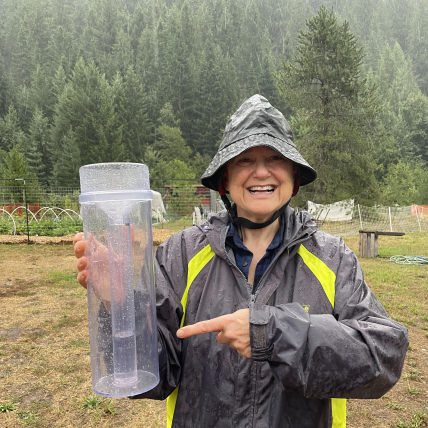
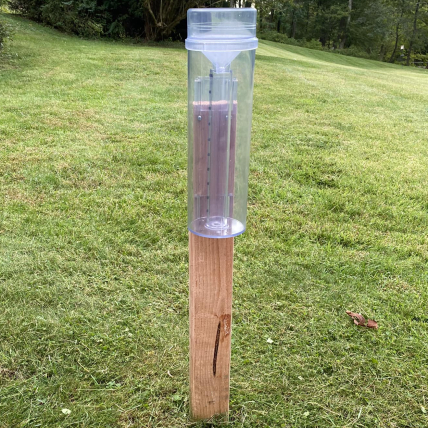
Precipitation is extremely variable — it can literally rain on one side of a street but not the other! Capturing variability like this is important for understanding precipitation patterns. CoCoRaHS volunteers use standardized National Weather Service approved rain gauges offsite link to help fill in the gaps and showcase the variability of precipitation by measuring and reporting what fell at their location.
About the CoCoRaHS Data Explorer
The CoCoRaHS Data Explorer offsite link (DEx) is a user-friendly online tool that provides observers and other users easy access to the 69+ million daily precipitation reports collected by volunteers. The tool uses innovative visualization products that allow anyone to explore the data. The development of this tool was supported by NOAA’s Office of Education through the Cooperative Institute for Research in the Atmosphere offsite link.
“This tool is extremely valuable for assisting volunteers that contact us with questions about their data,” says Noah Newman, CoCoRaHS Education Coordinator. “... I’m now able to instantly view [the data], and can help users more efficiently than ever before. This improves my overall customer service and the integrity of the data we collect.”
With the Data Explorer, users can search for stations by map, or filter for stations that have been collecting data consistently over a long period of time. DEx includes both past and current observations, which means users can explore how patterns of precipitation are changing. Anyone can find and view precipitation measurements, compare them to long-term averages computed by NOAA, and more. The data that volunteers collect have a range of uses from water resource analysis and severe storm warnings to neighbors comparing how much rain fell in their backyards.

DEx is easy to use and useful to all
The graphical layout of this tool helps make data exploration accessible to those that may not have scientific training, like young learners or teachers and educators new to the field. The platform supports active learning and inquiry by facilitating the exploration of data needed for student and community-driven research. By making the data broadly accessible, the DEx supports the NOAA Education Strategic Plan, which states “... the use of data in scientific inquiry is the foundation for our work. We support a science-informed society where everyone, regardless of their background or profession, can use science to keep up with our changing planet.”
People who rely on and are involved with CoCoRaHS data are excited about DEx, with some users having awaited a robust visualization tool to showcase precipitation data for years. See for yourself what people are saying about this new tool:
The DEx program is AMAZING. I've been using it all summer to help with drought monitoring and classification! With a number of stations having reported through some of our recent really bad droughts, it makes looking back and parsing data so nice. And then we had some near-record rains in September that the viewer was super helpful with as well! I CANNOT wait to use it this winter.
As a former National Weather Service observer and statistician for hydrologic research, I found this very useful. Thanks so very much for all your hard work in developing this product!
This is great! Seeing the data formatted so visually makes the daily inputs seem less like a giant black hole of statistics and very real. Love the year to year comparisons. Well done.
As a retired systems engineer, I can appreciate the value of good data visualization tools, and also the ingenuity and effort it takes to create them. Specifically: Loads fast, no issues with lag or dropouts. Graphs and fonts are easy to make out and read, excellent ‘Help’ tab content. They do an excellent job explaining what's going on.
It is a great way to explore and interact with my and other stations' data.
Easy to use, great visualizations. The normals comparison is the best feature, been looking for something like this for a long time.
This is what I have been looking for. I have been doing a long term bird study looking at the effect of weather and climate on reproductive performance beginning in 2006. … Long term precip and temp records are essential for this effort.
The new Data Explorer utility is absolutely beautiful. I'm amazed at its functionality and rapid response to my data manipulation efforts. One thing I learned is that 21% of the annual rainfall recorded at my station to date in 2023 came from just two 24 hour or less rainfall events. I could have calculated that data by myself but it would have taken a lot of time. Very pleased and excited to have the Data Explorer up and running in such an efficient, productive and user-friendly manner.
Learn more with the DEx video tutorial
“The Data Explorer empowers people to engage with and learn from millions of volunteer precipitation observations,” says John McLaughlin, NOAA Citizen Science Coordinator. “It supports Objective 3.C of our Citizen Science Strategy which encourages projects to maximize accessibility of their data.”
For more information on how you can get the most out of the Data Explorer tool, watch this brief video tutorial offsite link or view the in-depth version below.
The only requirements include an enthusiasm for watching and reporting weather conditions and a desire to learn more about how weather can affect and impact our lives. Join CoCoRaHS and you, too, can have your own dot on the map!


