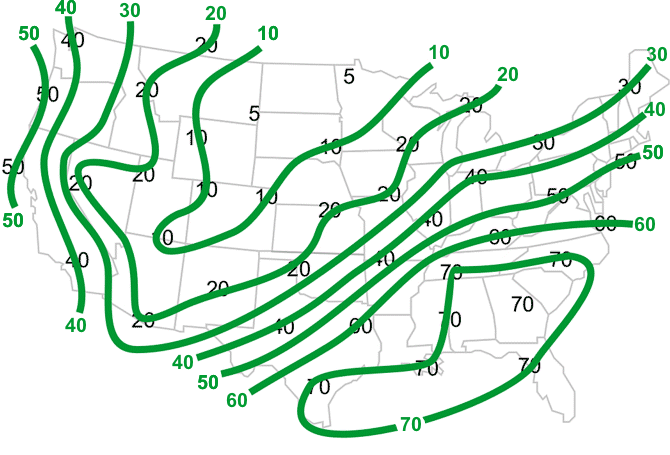
This map shows the dew point temperature for various locations over the contiguous U.S. The values are in °F. Recall that dew point is the temperature to which, if the air cooled to this value, then the air would be completely saturated.
- Objective
-
Using a green colored pencil, lightly draw lines connecting equal values of dew point temperatures every 10°F. Remember, like isobars, these lines (called isodrosotherms) are smooth and do not cross each other.
- Procedure
-
You will draw lines connecting the dew point temperatures, much like you did with the air temperature map, including needing to interpolate between values. Interpolation involves estimating values between stations, which will enable you to properly analyze a map. Label the values.
Your map should look like this.

Learning Lesson: Drawing Conclusions - Dew Point Analysis - Analysis
-
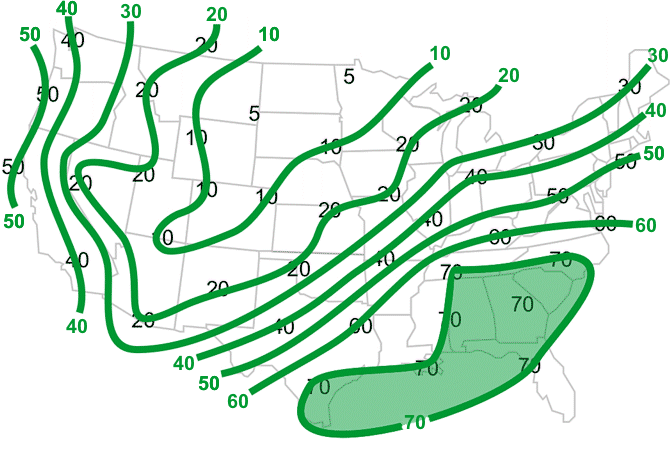
Isodrosotherms are used to identify surface moisture. The closer the temperature and dew point are together, the greater the moisture in the atmosphere. As the moisture increases, so does the chance of rain. Also, since moist air is lighter than dry air, the greater the moisture, the easier for the moist air to lift into the atmosphere, resulting in a better chance for thunderstorms. Typically, dew point 70°F or greater have the potential energy needed to produce severe weather.
- Shade in green the region where dew point temperatures are 70°F or greater.
Your map should look like this.
 Learning Lesson: Drawing Conclusions - Location of highest dew points


