Overview
To explain the weather, meteorologists often refer to ridges and troughs in the upper atmosphere and depict them with lines on a weather map. These weather systems are high and low places in the atmosphere, as this lesson will demonstrate.
| TOTAL TIME | 5 minutes |
|---|---|
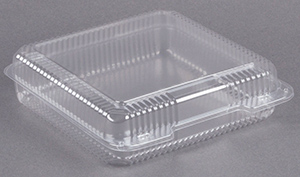
| SUPPLIES | Ten large clear hinged lid plastic containers (9” x 9” salad trays). Black and red permanent marker pens (but any two different bold colors will work). |
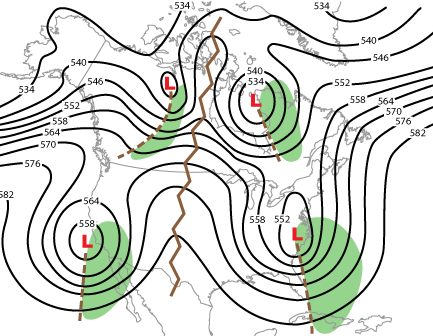
| PRINTED/AV MATERIAL | Base map; 500 mb chart |
| TEACHER PREPARATION |
You can prepare this beforehand, do it as a demonstration yourself, or have the students perform their own demonstration. An Internet search will provide resources to obtain salad trays or ask a local deli to provide some trays. Separate the salad tray’s top from bottom at the hinge. If both tops and bottoms are clear you will have two sets of material per tray. |
| SAFETY FOCUS | Turn Around, Don't Drown |
Procedure

- Print the base map and position one salad tray (top or bottom half) on top.
- Using a black permanent marker, place a dot on the tray over each of the two dots on the map, then trace the North America outline. This is your base background image, with dots used for alignment.
- Using a similar top or bottom, nest a tray over the tray with the North America outline. Carefully add dots onto the nested tray over the bottom dots. Remove the nested tray and set it aside.
- Repeat, adding the two dots to each of the remaining eight salad trays. When finished, you will have one tray with a map and two dots and nine trays with two dots each (When salad trays are stacked, all dots should be in line vertically.)
- Place one of the nine trays over the 500 mb chart.
- Beginning with the 582-contour (5,820-meter height of 500 mb pressure), and using the red marker, trace that contour only onto the salad tray. Label that contour "582". Set salad tray aside. Note: All contours should be drawn in the same color. The different colors on the 500 mb chart are just an aid to assist in differentiating contours when tracing.
- Take another salad tray, align the dots with the 500 mb chart, then trace and label the 576-contour only (orange line on the map).
- Continue until you have one different contour line on each salad tray. Notice that some contours (for example 564, 558) are located at more than one position on the map and will need to be added to the appropriate salad tray.
- Beginning with the North America outlined tray, nest the 534-contour tray on top. Continue nesting the remaining trays (from lowest to highest contour) for a 3D view of the 500 mb chart.
Discussion

When the salad trays are stacked properly, it will be readily apparent that ridges and troughs are high and low places in the atmosphere. Students will be able to see that when the meteorologists mentions an upper level ridge, the 500 mb heights is physically higher in the atmosphere.
Conversely, an upper level low pressure area is where the height of the 500 mb level is lower in the atmosphere.
The spacing between contours is governed by the temperature of the atmosphere at that level. The closer the spacing, the greater the difference in temperature at that location. It also means the wind speed at that location is faster than where the spacing between contours is greater.
To the right side of the trough axis, the air is physically ascending as the height of the 500 mb level increases. These are the regions where precipitation is likely to occur due to the rising motion of the air.
Conversely, on the left side of the trough axis, the air is descending, leading to fair weather.
Building a Weather-Ready Nation
Flash floods are the deadliest natural disaster in the world. They are often caused by stationary or slow-moving thunderstorms that produce heavy rain over a small area.
Hilly and mountainous areas are especially vulnerable to flash floods, where steep terrain and narrow canyons can funnel heavy rain into small creeks and dry ravines, turning them into raging walls of water. Even on the prairie, normally-dry draws and low spots can fill with rushing water during very heavy rain.
Take time to develop a flood safety plan for home, work, or school, and wherever you spend time. The National Weather Service has additional information about flood safety.
Preparations at home and work:
- Know the name of the county where you live and nearby rivers and streams. Keep a map so you know where storms that may cause flash flooding are.
- Determine if you are in a flood-prone area. If you are, know where to go if the water starts to rise. Have an escape route if you have to leave quickly.
- Make a safety kit containing: A flashlight and extra batteries, battery-powered weather radio receiver and commercial radio, extra food and water, first-aid supplies, canned food and a can opener, water (three gallons per person), extra clothing, and bedding. Don't forget special items for family members such as diapers, baby formula, hygiene products, prescription or essential medications, extra eyeglasses or hearing aids, and pet supplies.
- Know how and when to shut off utilities: Electricity, gas, and water.
- Get local warning information from your phone, TV, or the NOAA Weather Radio.

