Introduction to Upper Air Charts
One of the first things to always keep in mind is that "weather is like the humidity; it's all relative". In most aspects of weather, observed values of pressure and temperature are not as important as the change in pressure or the change in temperature. In meteorology, we refer to the "change in" as a gradient.
One of the first things to always keep in mind is that "weather is like the humidity; it's all relative". In most aspects of weather, observed values of pressure and temperature are not as important as the change in pressure or the change in temperature. In meteorology, we refer to the "change in" as a gradient.
Any time there is a rapid change in a particular weather element, we will say the "gradient" is large. It is near these large gradients where the weather is most active.
A common example is found near cold fronts. The change in air pressure is typically rapid near a cold front, and, therefore, the pressure gradient is large. The greater the pressure gradient is near a front, the stronger the wind. This is also true for the upper atmosphere.
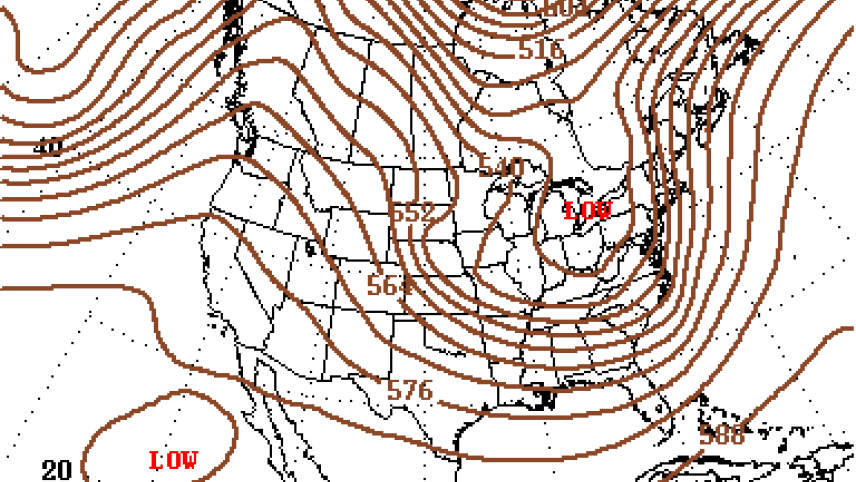
While the information provided by a Skew-T chart is invaluable, it can only tell us what is happening in the atmosphere at that location. To paint a complete picture of the atmosphere as a whole, we need to view radiosonde data from many upper air observations.
We do this by creating constant pressure charts that let us see changes and gradients in atmospheric conditions across the country and around the world.


