Layers of the Ocean

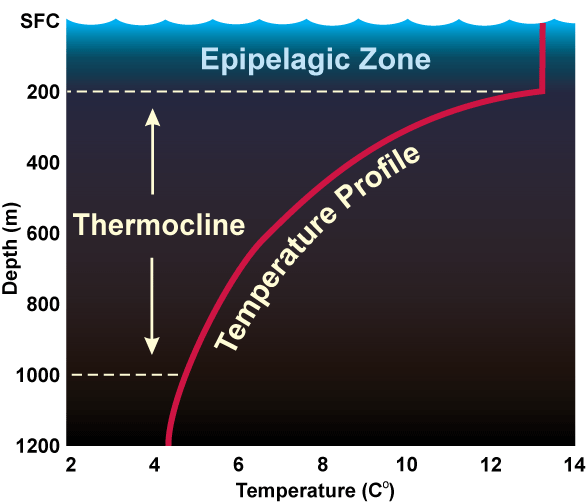
Typical seawater temperature
Typical seawater temperature profile (red line) with increasing depth.
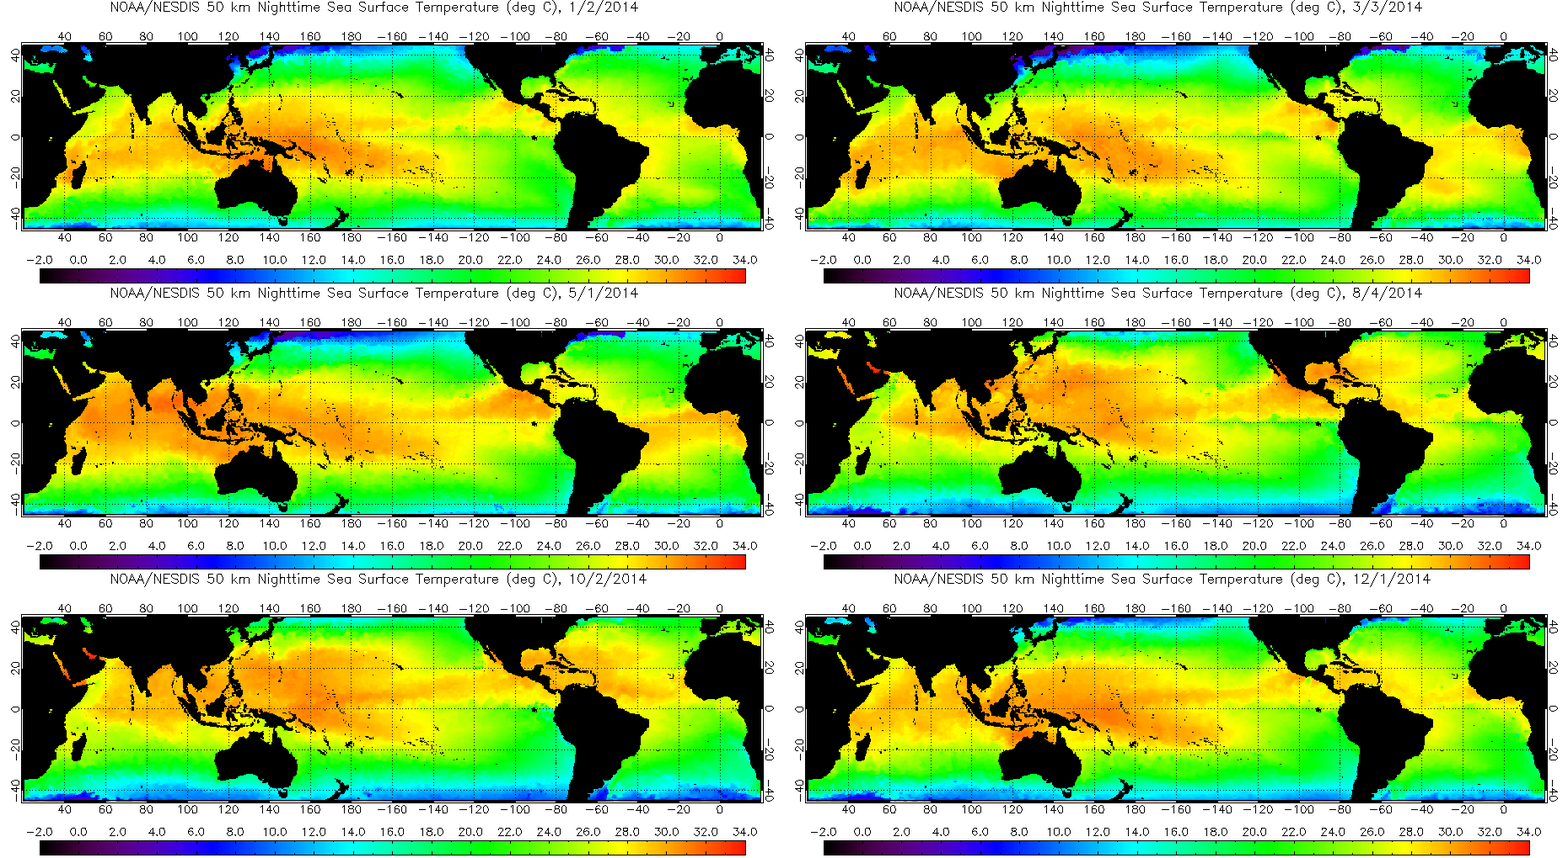
Sea surface temperature loop, by month, for 2014
Sea surface temperatures for a single year: 2014 (900 kb).
Download Image
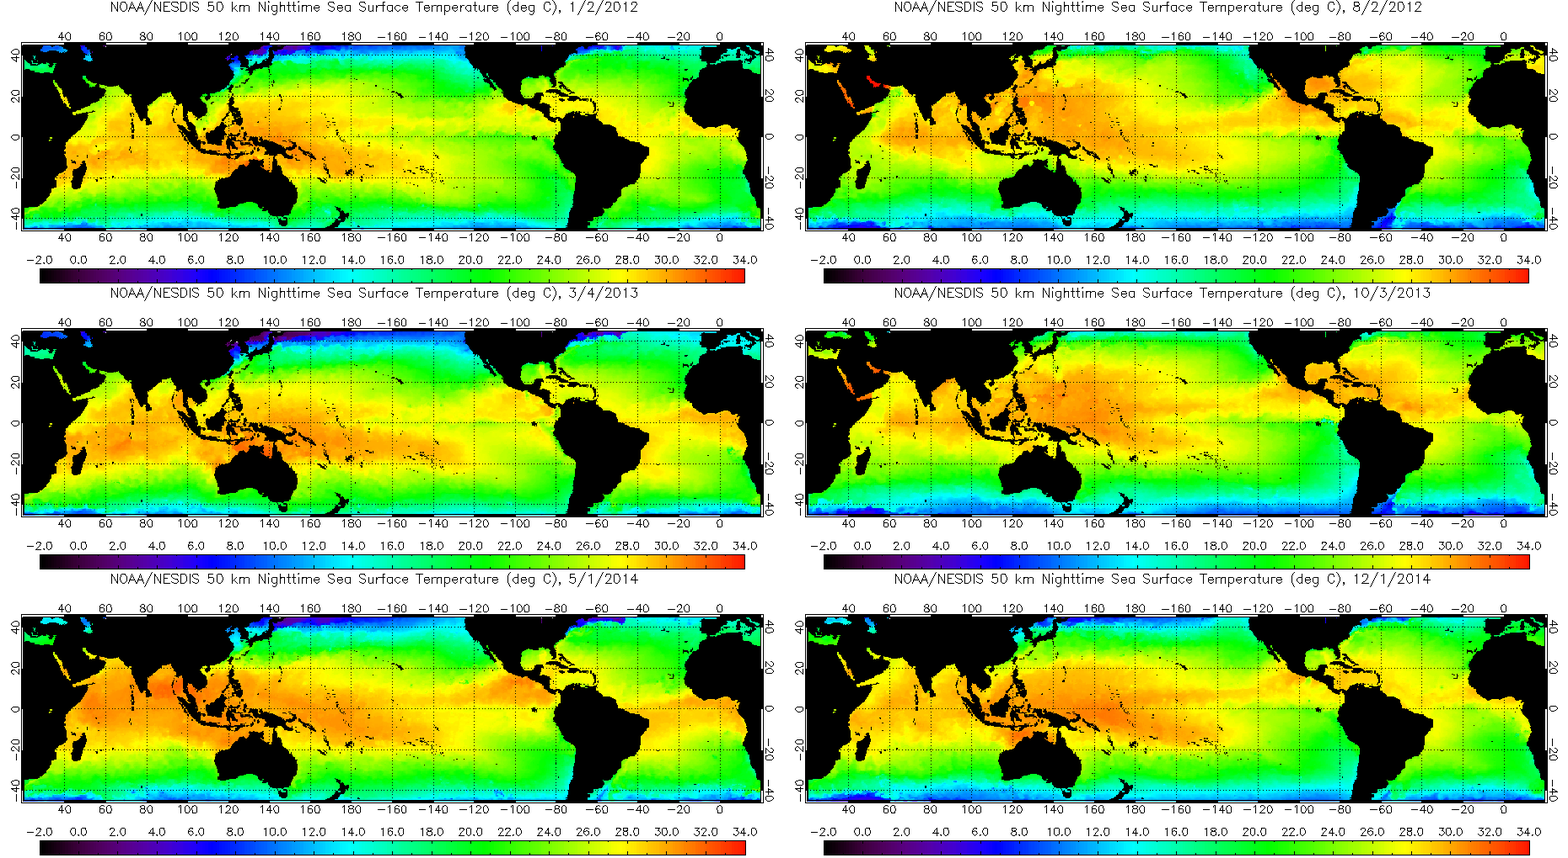
Sea surface temperature loop, by month, for 2012-14
Sea surface temperatures over three years: 2012-14 (2.6 mb)
Download Image
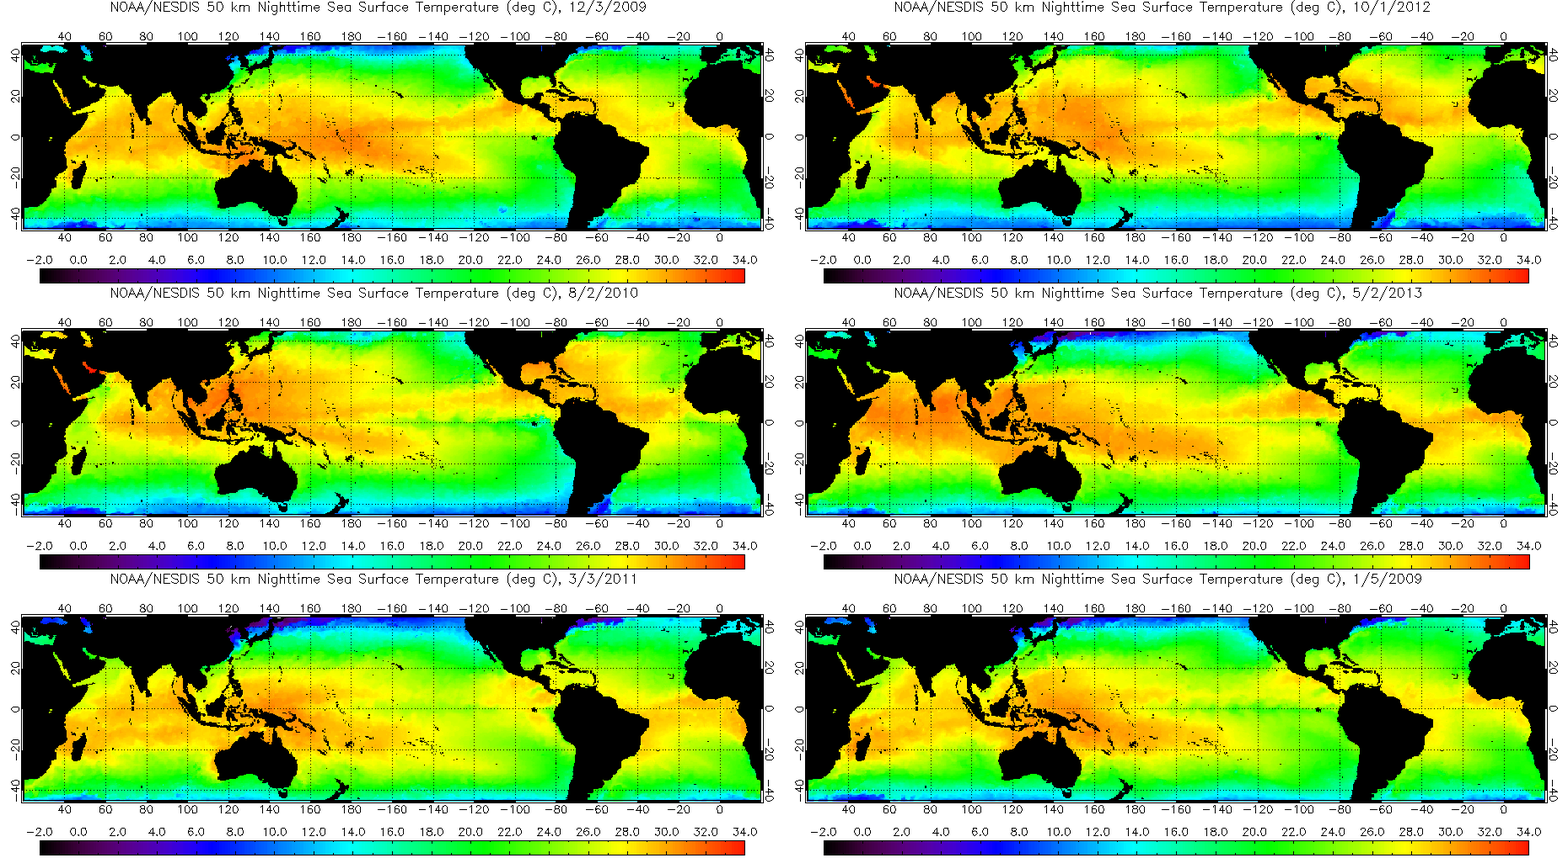
Sea surface temperature loop, by month, for 2009-2014
Sea surface temperatures over six years: 2009-14 (5.4 mb)
Download Image


Diagram of the relative depths of each ocean layer.

Epipelagic Zone
This surface layer is also called the sunlight zone and extends from the surface to 200 meters (660 feet). It is in this zone that most of the visible light exists. With that sunlight comes heat from sun, which is responsible for wide variations in temperature across this zone, both with the seasons and latitudes - sea surface temperatures range from as high as 97°F (36°C) in the Persian Gulf to 28°F (-2°C) near the North Pole.

Wind keeps this layer mixed and thus allows the sun's heat to be distributed vertically. The base of this mixing layer is the beginning of the transition layer called the thermocline.

Mesopelagic Zone
Below the epipelagic zone is the mesopelagic zone, extending from 200 meters (660 feet) to 1,000 meters (3,300 feet). The mesopelagic zone is sometimes referred to as the twilight zone or the midwater zone, as sunlight this deep is very faint. Temperature changes are the greatest in this zone because it contains the thermocline, a region where water temperature decreases rapidly with increasing depth, forming a transition layer between the mixed layer at the surface and deeper water. The depth and strength of the thermocline varies from season to season and year to year. It is strongest in the tropics and decrease to non-existent in the polar winter season.

Because of the lack of light, bioluminescence begins to appear on organisms in this zone . The eyes on the fishes are also larger and generally upward directed, most likely to see silhouettes of other animals (for food) against the dim light.

Bathypelagic Zone
The depths from 1,000-4,000 meters (3,300 - 13,100 feet) comprise the bathypelagic zone. Due to its constant darkness, this zone is also called the midnight zone. The only light at this depth and lower comes from the bioluminescence of the animals themselves.

The temperature in the bathypelagic zone, unlike that of the mesopelagic zone, is constant. The temperature never fluctuates far from a chilling 39°F (4°C). The pressure in the bathypelagic zone is extreme and at depths of 4,000 meters (13,100 feet), reaches over 5850 pounds per square inch! Yet, sperm whales can dive down to this level in search of food.

Abyssopelagic Zone
The Abyssopelagic Zone (or abyssal zone) extends from 4,000 meters (13,100 feet) to 6,000 meters (19,700 feet). It is the pitch-black bottom layer of the ocean. The water temperature is constantly near freezing, and only a few creatures can be found at these crushing depths.

The name (abyss) comes from a Greek word meaning "no bottom" because they thought the ocean was bottomless. Three-quarters of the area of the deep-ocean floor lies in this zone.

Hadalpelagic Zone
The deepest zone of the ocean, the hadalpelagic zone extends from 6,000 meters (19,700 feet) to the very bottom, 10,994 meters (36,070 feet) in the Mariana Trench off the coast of Japan.

The temperature is constant, at just above freezing. The weight of all the water over head in the Mariana Trench is over 8 tons per square inch.

Even at the very bottom, life exists. In 2005, tiny single-celled organisms called foraminifera, a type of plankton, were discovered in the Challenger Deep trench southwest of Guam in the Pacific Ocean. The deepest a fish have ever been found, Abyssobrotula galatheae, was in the Puerto Rico Trench at 8,372 meters (27,460 feet).

Typical seawater temperature
Typical seawater temperature profile (red line) with increasing depth.
Sea surface temperature loop, by month, for 2014
Sea surface temperatures for a single year: 2014 (900 kb).
Download Image
Sea surface temperature loop, by month, for 2012-14
Sea surface temperatures over three years: 2012-14 (2.6 mb)
Download Image
Sea surface temperature loop, by month, for 2009-2014
Sea surface temperatures over six years: 2009-14 (5.4 mb)
Download Image