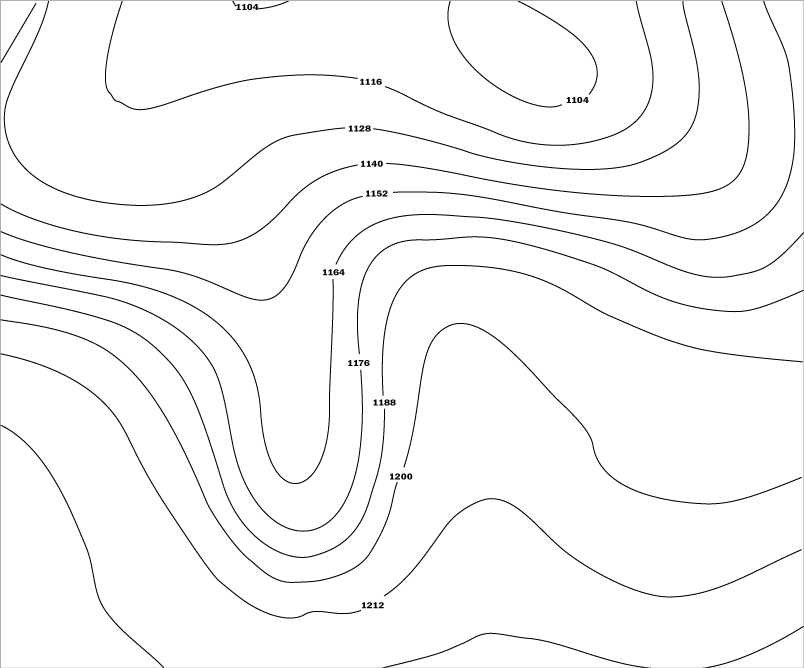
The air pressure everywhere on this constant pressure chart is 200 millibars. The lines represent the height, in meters, of the altitude of 200 mb.
An air pressure of 200 millibars is said to occur near 39,000 feet (12,000 meters) in elevation, but the height ranges from near 35,000 to 41,000 feet (10,800 to 12,300 meters).
The height values on upper air charts are truncated, meaning there are certain digits that are always the same and are omitted to decrease clutter on the map. On most 200 mb charts, the first digit, 1 (one), and the last digit, 0 (zero), is omitted. Adding the 1 to the beginning and 0 to the end of the three digit height value reveals the actual height in meters.
For example, a height value of "212" means the actual height is 12,120 meters (39,763 feet). In the example chart below, only the last digit, "zero", is truncated.
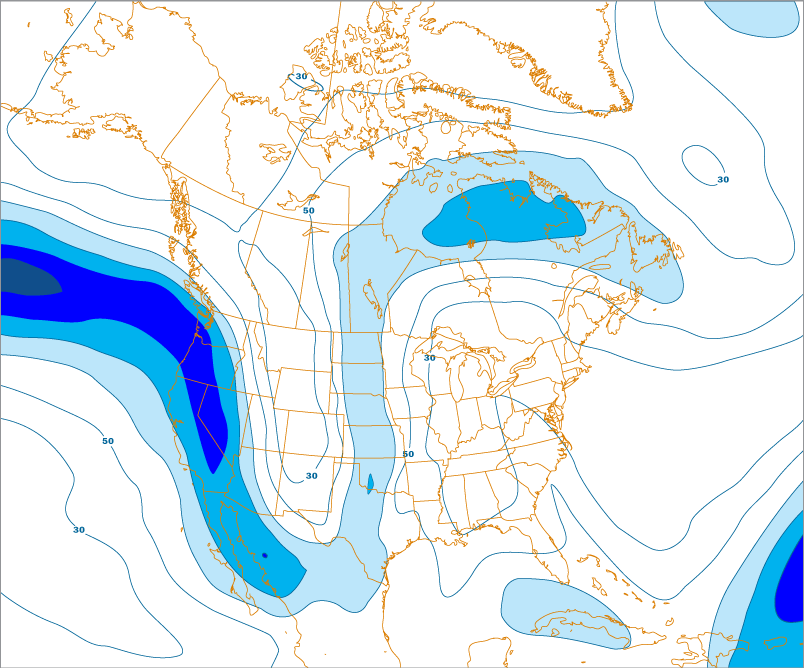
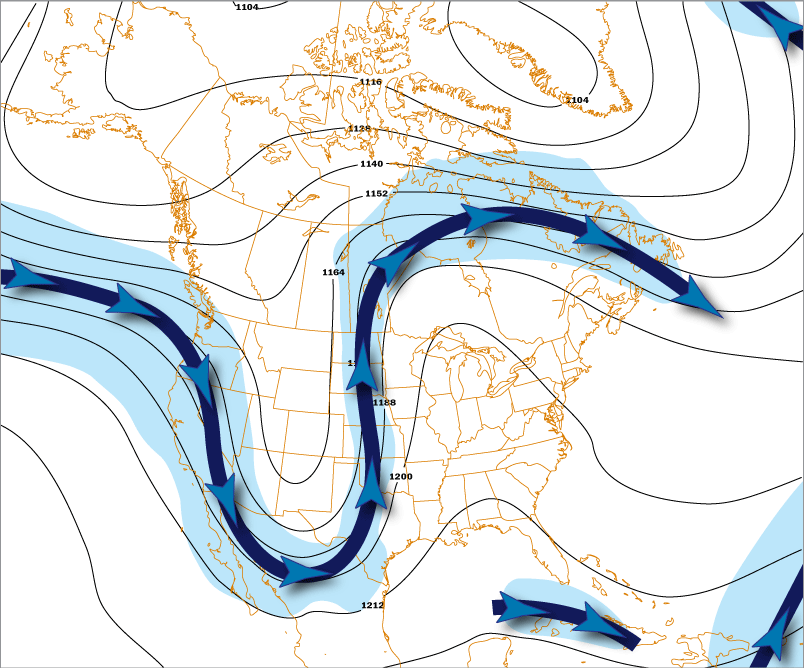
This chart (as well as the 300 mb chart) is primarily used to locate the jet stream. The jet stream is identified by where the wind speed is 70 kt (81 mph / 130 km/h) or greater (blue shading).
Therefore, contours of equal wind speed (isotachs, drawn at 20 kt intervals) are common on this chart. At this altitude, the direction of the wind almost always flows parallel to the contours.
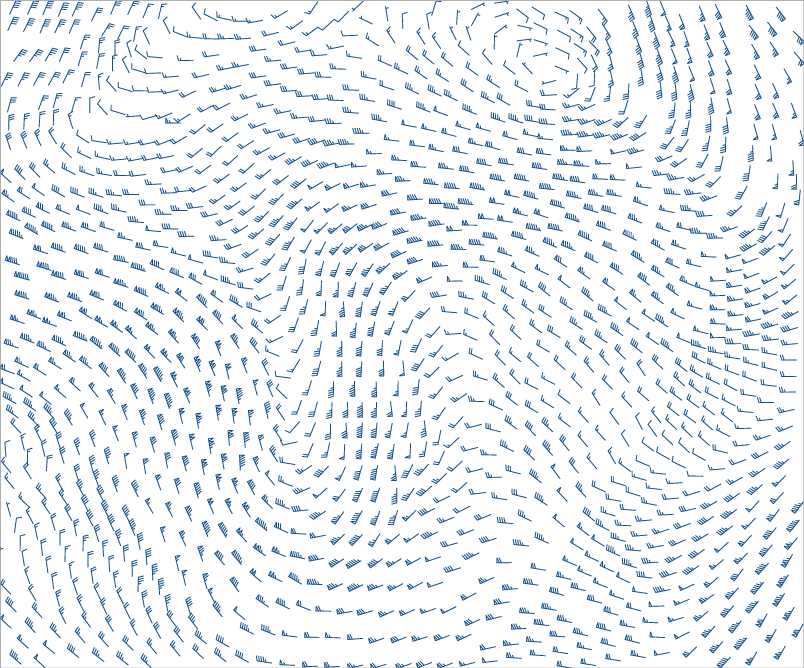
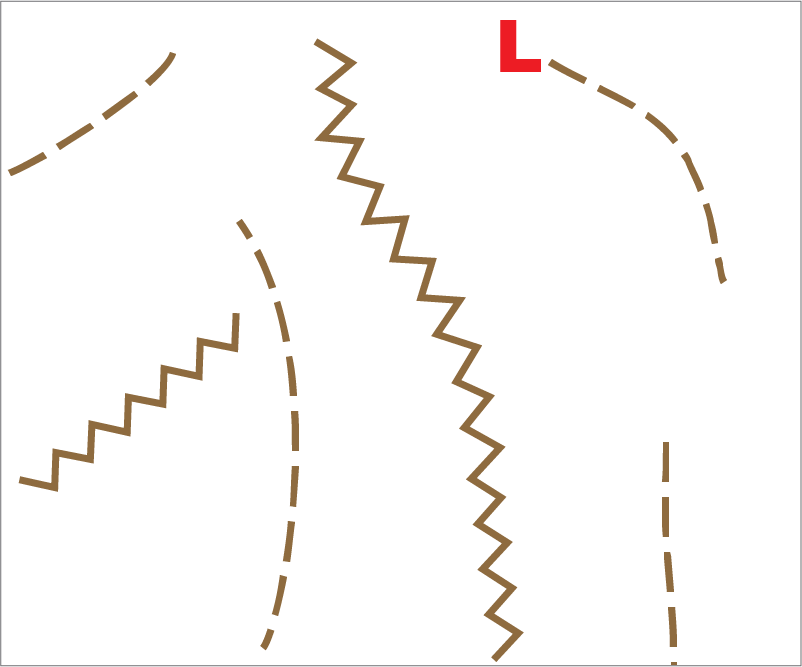
On the map (below), the toggles for wind contours, heights, and barb show what is typically displayed on the 200 mb chart. The toggles for the trough/ridge and jet stream are for illustrative purposes and generally are not seen on constant pressure charts.
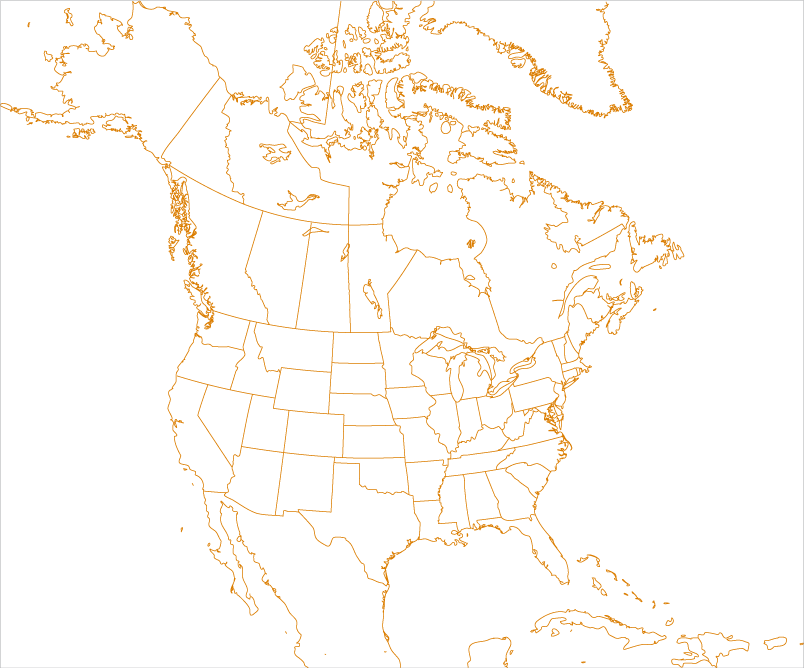
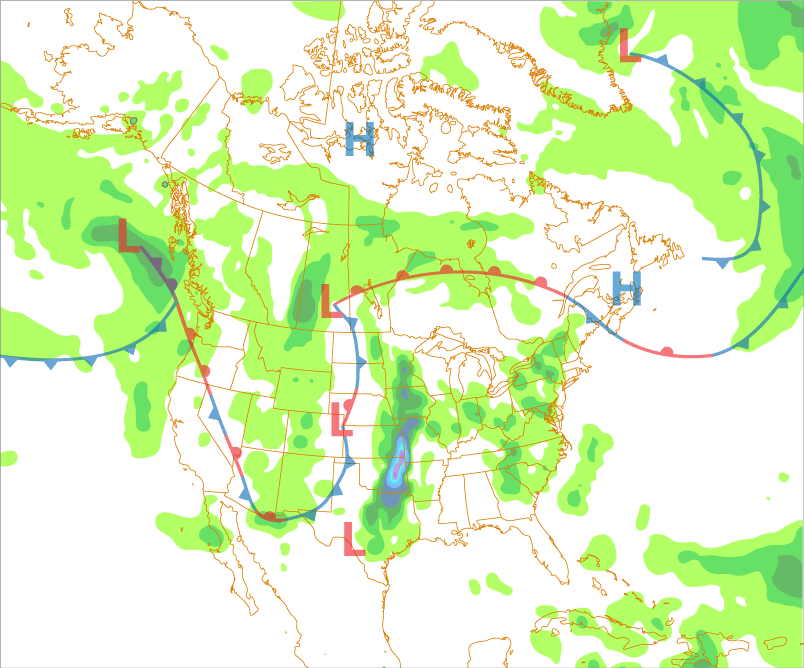
The surface weather toggle shows the location of highs, lows, fronts, and precipitation relative to the 200 mb level.