The motion of air in the atmosphere is extremely complicated. From large-scale synoptic motion we see high and low pressure systems at the surface and ridges and troughs in the air aloft. Embedded in synoptic motion is mesoscale motion from which we see sea breezes, drylines, and squall lines, etc.
Even smaller than mesoscale is microscale, which is typically too small to be depicted on weather maps. This scale includes things like fair weather cumulus clouds (small clouds) that are here one minute and gone the next.
All weather is caused by atmospheric motions that can be described by mathematical equations. From these equations, we can calculate future motions. Numerical weather prediction is the use of computers to model the atmosphere and predict how atmospheric motions change both horizontally and vertically with time.
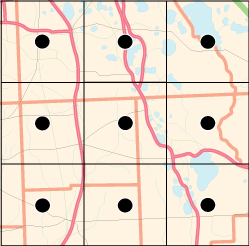
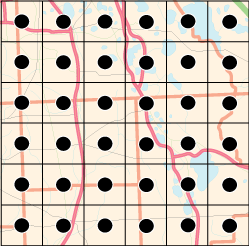
There are two basic sizes of models: global (covering the entire Earth) and regional (covering part of the Earth). Each of these models utilizes a grid system where forecast points are laid out in a grid over the area they cover. The distance between centers of these grids, called grid points, vary with scale and design of the model.
The more grid points there are in any model, the finer the resulting detail in the forecast. However, as the number of grid points increases, so does the need for more computing power.
For example, a forecast for 6 x 6 grid (36 forecast points) needs four times the computing time as a 3 x 3 grid (9 forecast points) even though the actual physical area remains the same. Forecast precision improves at the cost of four times the number of calculations used to produce a forecast for the same physical area.


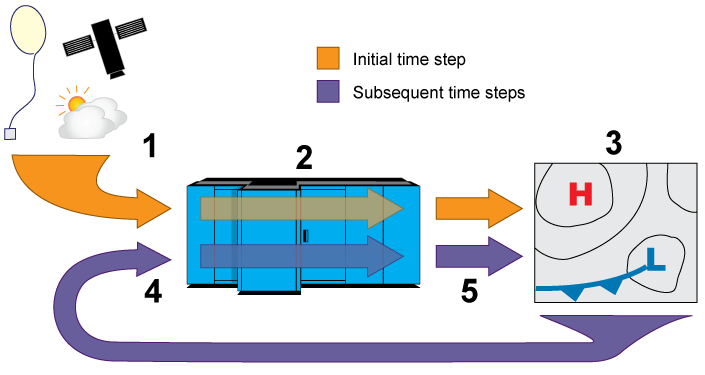
Regardless of the grid size, all models must know the initial condition to begin computations in order to make a forecast. A variety of weather data is input into the model from radiosondes, weather satellites, surface observations over land and sea, as well as information from commercial aircraft in a process called initialization (#1 in image below).
Upon the input of this initial data, the computer will use mathematical equations to calculate a future state of the atmosphere in a "time step". Depending upon the type of model and aerial coverage, a time step interval can be as short as a few seconds or as long as several minutes. (#2 in image below)

The resulting state of the atmosphere calculated at the end of the time step (#3 in image above) then becomes the new initialization input for a repeat of calculations (#4 in image above) for the next time step. This gives the new time step result (#5 in image above).
This process, where the result of the previous time step becomes the initial input for the next time step, repeats itself until the end of the model run.
The length of the time step greatly affects model accuracy. Smaller time step intervals produce more accurate forecasts as there is less variation in output at the end of each computation. But the cost is that smaller time steps require more computations. Conversely, large time step intervals require less computation time but introduce larger variations in output.
Therefore, a tradeoff exists between time step interval lengths and grid sizes verses computational power. In the future, as computing power increases, we will be able to have smaller time step intervals and smaller grid sizes leading to more accurate forecasts.
For now, this is why weather models are generally accurate out four days or so. Beyond about day 4, differences from one model run to the next begin to show increasing variations in forecasts.
National Centers for Environmental Prediction
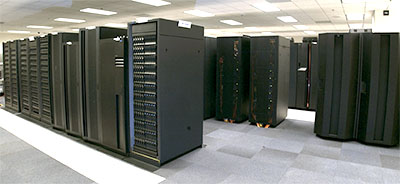
Supercomputers are used for the trillions upon trillions of computations needed to produce weather models. For example, the Global Forecast System model needs over 10 quadrillion (10 with 16 zeros) calculations for a complete model run forecast that takes two hours to complete the process. This model runs four times daily.
The NCEP Environmental Modeling Center produces several models with varying time scales and grid sizes. The Global Forecast Systems suite of models covers the largest scale, and there are several regional models, such as the North American Mesoscale Forecast Systems (NAM) and Rapid Refresh (RAP).
The Environmental Modeling Center weather models have continually improved in accuracy and will continue to do so in the future. As computers become faster, the grids will become smaller for better horizontal and vertical resolution. Also, the math used in the calculations will improve as more data become available to provide better initialization.
For real-time model output, go to the National Center for Environmental Prediction's forecast model page.
Take it to the MAX! Model Output Statistics (MOS)

