Fast Facts
The highest dew points, and therefore the highest heat indices, are usually found near warm bodies of water.
The warmest water in the world is found in the Persian Gulf, where the water temperature typically reaches up to 90°F (32°C) in summer. Therefore dew points will be that high as well.
The highest dew point ever recorded, 95°F (35°C), was recorded at Dhahran, Saudi Arabia, on July 8, 2003. With an air temperature of 108°F (42°C), the heat index was 178°F (81°C).
In looking at the basic climate regions around the world, we can see that there are some places where the weather is considered hot. But heat alone does not make high temperatures a threat. There is an old saying stating "It's not the heat, it's the humidity." Actually it's both heat AND humidity.
Unlike the destruction of tornadoes, hurricanes, and floods, heat waves are not easily photographed, and, therefore, tend to not have the same visual impact as these other disasters. However, heat waves kill more people in the United States than all of the other weather-related disasters combined. The 10-year average (2013-2022) for heat related deaths in the U.S. is 153 in a typical year.
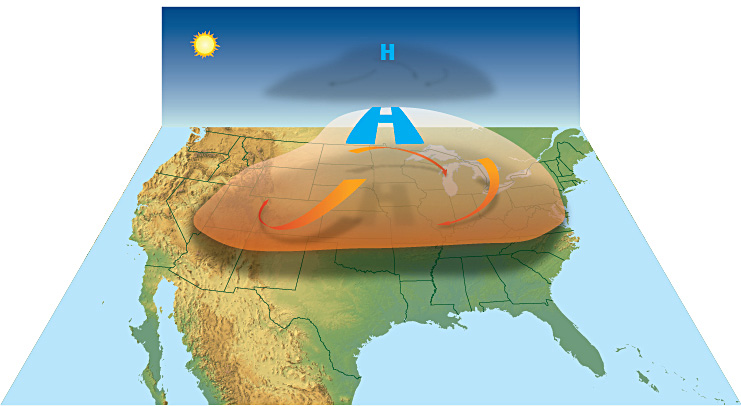
Heat waves form when high pressure aloft, from 10,000 to 25,000 feet (3,000 to 7,600 meters), strengthens and remains over a region for several days up to several weeks. This is common in summer in both Northern and Southern Hemispheres as the jet stream “follows the sun”. The high pressure area is on the equator side of the jet stream, in the middle layers of the atmosphere.

Summertime weather patterns are generally slower to change than winter weather patterns. As a result, this mid-level high pressure also moves slowly. Under high pressure, the air subsides (sinks) toward the surface. This sinking air acts as a dome capping the atmosphere.
This cap helps to trap heat instead of allowing it to lift. Without lift, there is little or no convection and, therefore, little or no convective clouds (cumulus clouds) with minimal chances for rain. The end result is a continual build-up of heat at the surface that we experience as a heat wave.
Our bodies dissipate heat in a few ways: varying the rate and depth of blood circulation, sweating from our skin, and, as a last resort, panting.
As the body heats up, the heart begins to pump more blood, blood vessels dilate to accommodate the increased flow, and the tiny capillaries in the upper layers of skin bring more blood near the surface. As blood is circulated closer to the skin's surface, excess heat drains off into the relatively cooler atmosphere through radiation or convection. We also sweat, which removes heat through evaporation, a process by which the body’s heat causes water in sweat to turn to water vapor, taking the heat with it.
At air temperatures below body temperature, radiation and convection are efficient methods of moving heat out of the relatively warmer body and into the relatively cooler air. However, once the air temperature reaches 95°F (35°C), close to the body’s normal average temperature of 98°F (37°C), heat loss by radiation and convection ceases. At this point, heat loss by sweating becomes all-important. But sweating does not remove heat if the sweat can’t evaporate, meaning that high relative humidity slows evaporation and thus prevents an important method of how our bodies cool themselves.
Relative humidity is the ratio, expressed as a percent (%), of the amount of atmospheric moisture present relative to the amount that would be present if the air were completely saturated.
Since the amount of atmospheric moisture needed to saturate the air depends on the temperature, relative humidity is a function of both moisture content and temperature. The warmer the temperature, the more moisture the air can contain before it becomes saturated. Therefore, with the same moisture content, warmer air will have a lower relative humidity than colder air.
The dew point temperature is the temperature at which saturation will occur given a particular moisture content. An example of how relative humidity changes based on the temperature is to take a constant dew point, such as 45°F (7°C). This means that for a specific moisture content, when the air temperature is also 45°F (7°C), the relative humidity is 100%. However, if the temperature increases to 75°F (24°C), the relative humidity drops to 34%, even though the moisture content remains the same!
So, what does this all mean? Sweat is evaporated (changes from a liquid to a gas, i.e. water vapor) when heat is added. The heat is supplied by your body. If the air is unsaturated, there is more room for water to evaporate into the surrounding air. If the air is saturated, however, little to no additional liquid can evaporate into the surrounding air, even though your body’s heat is warming the sweat, and so the heat remains in your body. The results are summed up in the table below.
| Relative Humidity | Amount of Evaporation | HEAT removed from the body | We feel |
|---|---|---|---|
| HIGH | lower | less | less comfortable |
| LOW | higher | more | more comfortable |
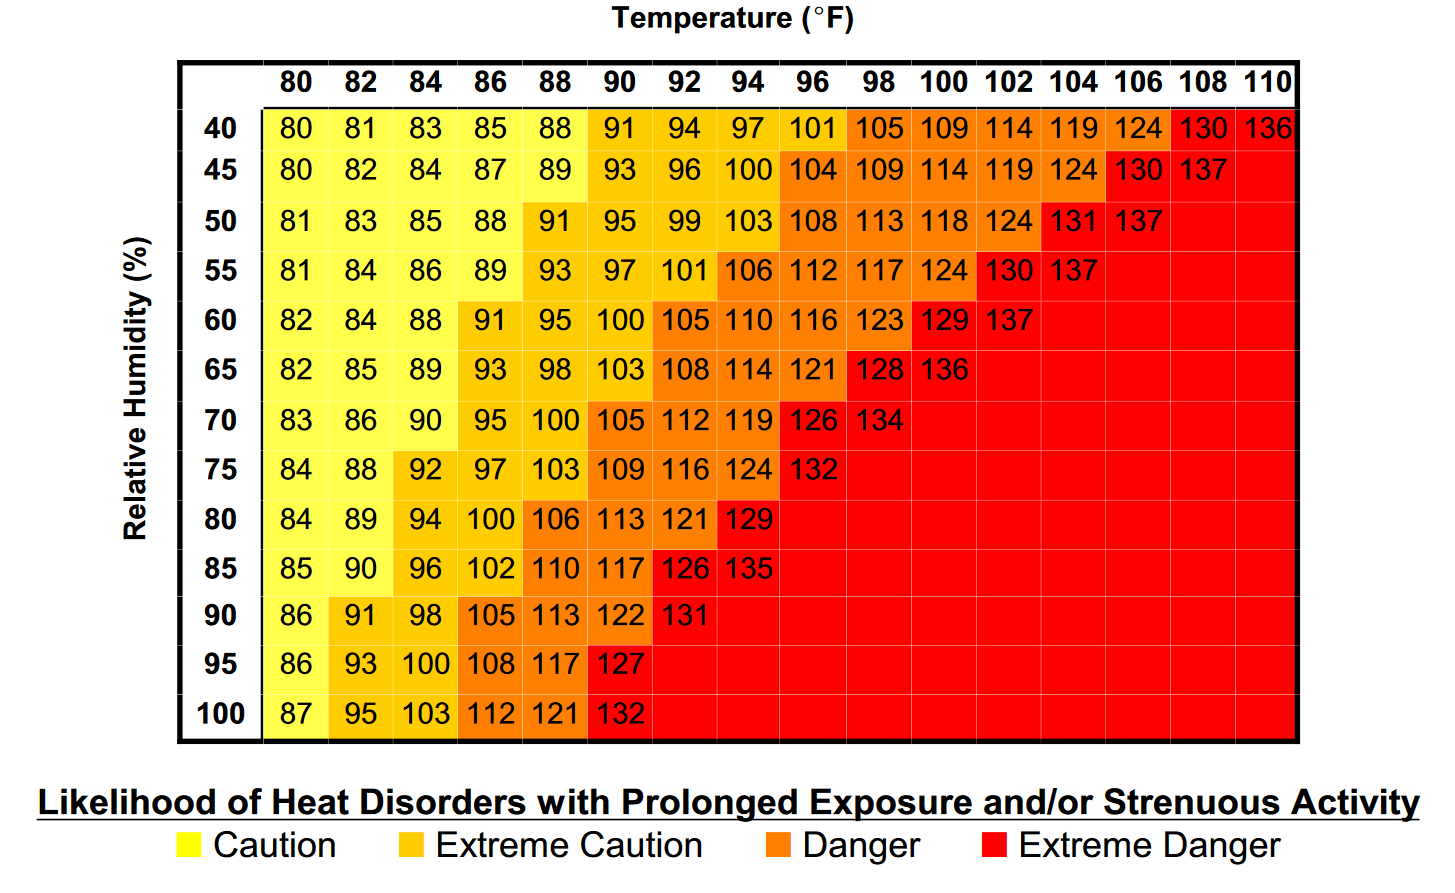
We at the National Weather Service, as part of our mission for protecting life and property, have a measure of how the hot weather "feels" to the body. The Heat Index is based on work by R.G. Steadman and published in 1979 under the title "The Assessment of Sultriness, Parts 1 and 2." In this work, Steadman constructed a table which uses relative humidity and dry bulb temperature to produce the "apparent temperature" or the temperature the body "feels".
We use this table to provide you with Heat Index values. These values are for shady locations only. Exposure to full sunshine can increase heat index values by up to 15°F (8°C). Also, strong winds, particularly with very hot, dry air, can be extremely hazardous as the wind adds heat to the body. The Heat Index Chart is below.

How to read the chart: Look for the temperature across the top, then find the relative humidity on the left. The point where they intersect on the chart tells you the Heat Index, color-coded by likelihood of a heat disorder. For example, look at an air temperature of 100°F (38°C) and Relative Humidity of 40%. The chart shows the Heat Index - how hot it feels - as 109°F (43°C), which is in the orange range for DANGER.
Remember, these values are in the SHADE. You can add up to 15°F (8°C) to these values if you are in direct sunlight.
Fast Facts
The highest dew points, and therefore the highest heat indices, are usually found near warm bodies of water.
The warmest water in the world is found in the Persian Gulf, where the water temperature typically reaches up to 90°F (32°C) in summer. Therefore dew points will be that high as well.
The highest dew point ever recorded, 95°F (35°C), was recorded at Dhahran, Saudi Arabia, on July 8, 2003. With an air temperature of 108°F (42°C), the heat index was 178°F (81°C).


