While typically plotted on surface charts, the thickness contours are derived from constant pressure charts. Thickness is the measurement of the distance (in meters) between any two constant pressure surfaces.
One of the most common thickness charts used in meteorology is the 1000-500 mb thickness. This is the distance between the elevation of the 1000 mb and 500 mb levels.
Typically, we use the 1000 mb surface to represent sea level, but that is a generalization. The 1000 mb surface varies in elevation just like any other pressure elevation.
In fact, the 1000 mb surface will often be below ground (or sea) level. The 1000-500 thickness values take that into consideration by estimating the elevation of the 1000 mb level.
As in the case of the 500 mb constant pressure chart, the last digit (zero) is truncated. So, a 1000-500 thickness chart value of 570 means the distance between the two surfaces is 5700 meters. The contours are drawn in 60-meter increments.

Fronts

These thickness values are directly related to air density and temperature. The colder the air, the denser the air becomes and thus the distance between any two height levels decreases. Conversely, warmer air is less dense, and, therefore, the distance between any two height levels increases.
Because of this, thickness charts are used to help identify fronts and boundaries between air masses. Since air temperatures almost always fall behind cold fronts, thickness contours can become bunched together on the cold air side of the front. This is called packing, and a meteorologist may say the thickness lines are "packed".
A word of caution: There is no hard and fast rule of thumb for determining fronts using thickness contours. Careful analysis, using multiple sources of information is needed to identify their locations.
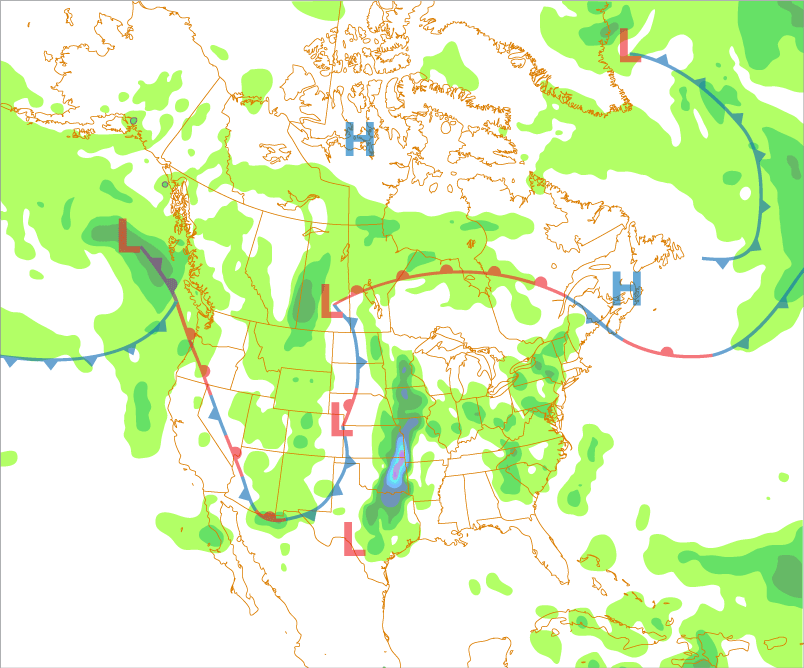
In the example at the bottom of the page, there is a packing of thickness lines In Oklahoma and Texas. Turning the surface weather overlay on reveals precipitation in eastern Oklahoma and Texas well ahead of the cold front.
Based upon the isobars, the front is located along the Colorado/Kansas border, extending south into the panhandle of Texas. The precipitation in east Oklahoma and Texas is from a dryline moving east ahead of the front.
A tighter packing of thickness lines is located in Canada south of Hudson's Bay. The warm front's location, indicated by the isobars, clearly demarks the colder air to the north of the warm front as opposed to the south side of the boundary.
Rain/Snow Line
 is approximately the point where precipitation changes from liquid to frozen or vice versa.")
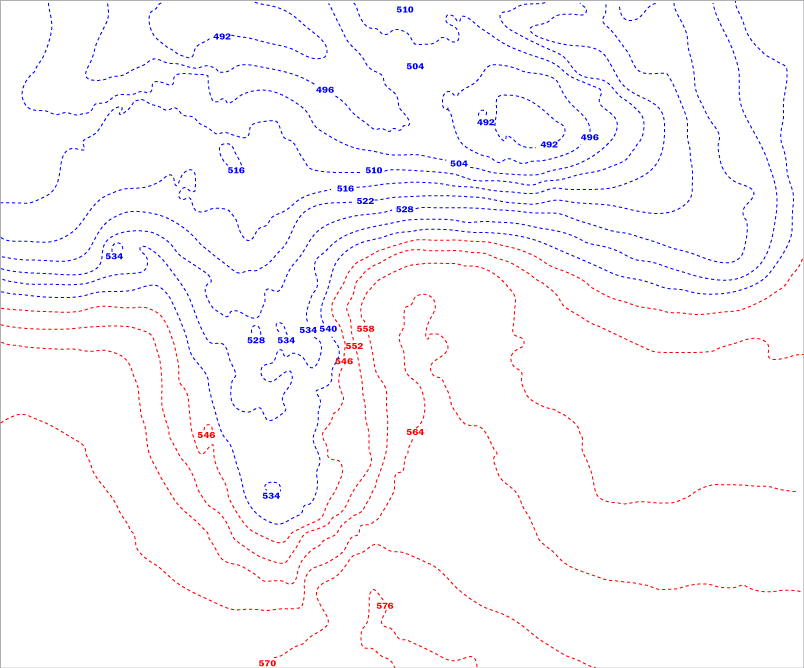
The 1000-500 mb thickness value of 540 (5,400 meters) is the traditional line to determine rain verses snow. The 540-contour closely follows the surface freezing temperature (32°F/0°C).
If precipitation is expected for locations pole-ward of the 540-thickness line, the rule of thumb is to predict snow.
If precipitation is expected on the equator side of this line, then the precipitation would be liquid. In the example below, the 540 (and lower) thickness lines are colored blue, and 546 (and higher) thickness lines and greater are colored red.
As with everything else in meteorology there are always exceptions, especially with seasons and terrain. But the 540-thickness line is a good first guess for determining rain verses snow.
Gustiness of Wind
The wind speed is governed by pressure differences (pressure gradients) which are indicated on surface charts by isobars.

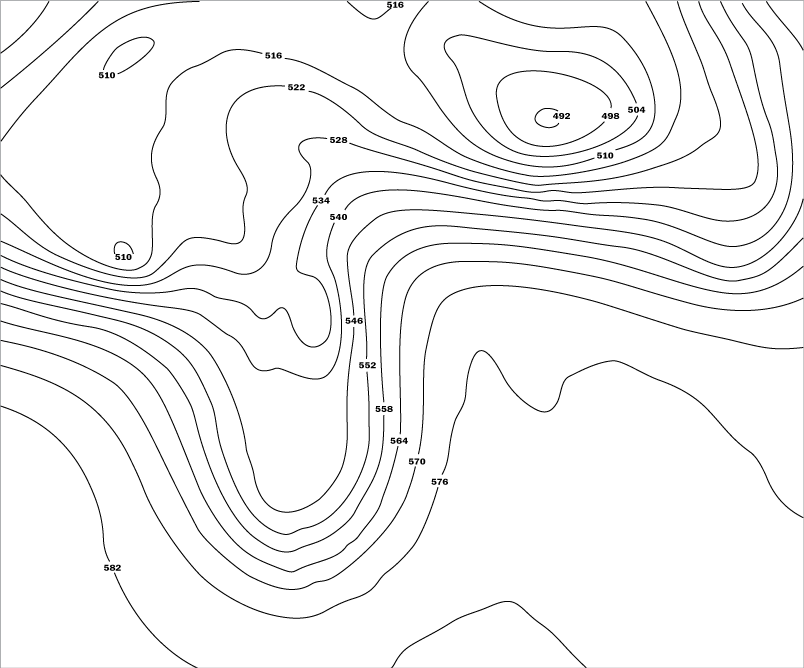
There is usually some variation in speed even in steady wind. That variation, or gustiness, increases based upon the angle at which thickness contours cross isobars.
Thickness lines that cross isobars at right angles indicate the gustiest winds. As the angle decreases, so does the wind's gustiness.
In the example (right), at #1, the dashed thickness lines cross the solid isobars at right angles. At #2, the thickness lines and isobars cross each other at much more shallow angles. Therefore, while the wind's speed is similar at both locations, it is gustier at #1 than at #2.