Fast Facts
The dBZ values equate to approximate rainfall rates indicated below.
| dBZ | Rain Rate (in/hr) |
Rain Rate (mm/hr) |
|---|---|---|
| 65 | 16+ | 420+ |
| 60 | 8.00 | 205 |
| 55 | 4.00 | 100 |
| 50 | 1.90 | 47 |
| 45 | 0.92 | 24 |
| 40 | 0.45 | 12 |
| 35 | 0.22 | 6 |
| 30 | 0.10 | 3 |
| 25 | 0.05 | 1 |
| 20 | 0.01 | Trace |
| < 15 | No rain | No rain |
These are hourly rainfall rates only and are not the actual amounts of rain a location receives. The total amount of rain received varies with intensity changes in a storm as well as the storm's motion over the ground.
Reflectivity is one of the three base products that are produced by pulsed Doppler radars and is likely the product most familiar to the general public. As the name implies, reflectivity is the amount of energy that is returned (reflected) back to the receiver after hitting a target. Reflectivity products are generally shown on television and are available on numerous websites. Reflectivity is the most frequently used product by forecasters to indicate where precipitation and severe weather is occurring.
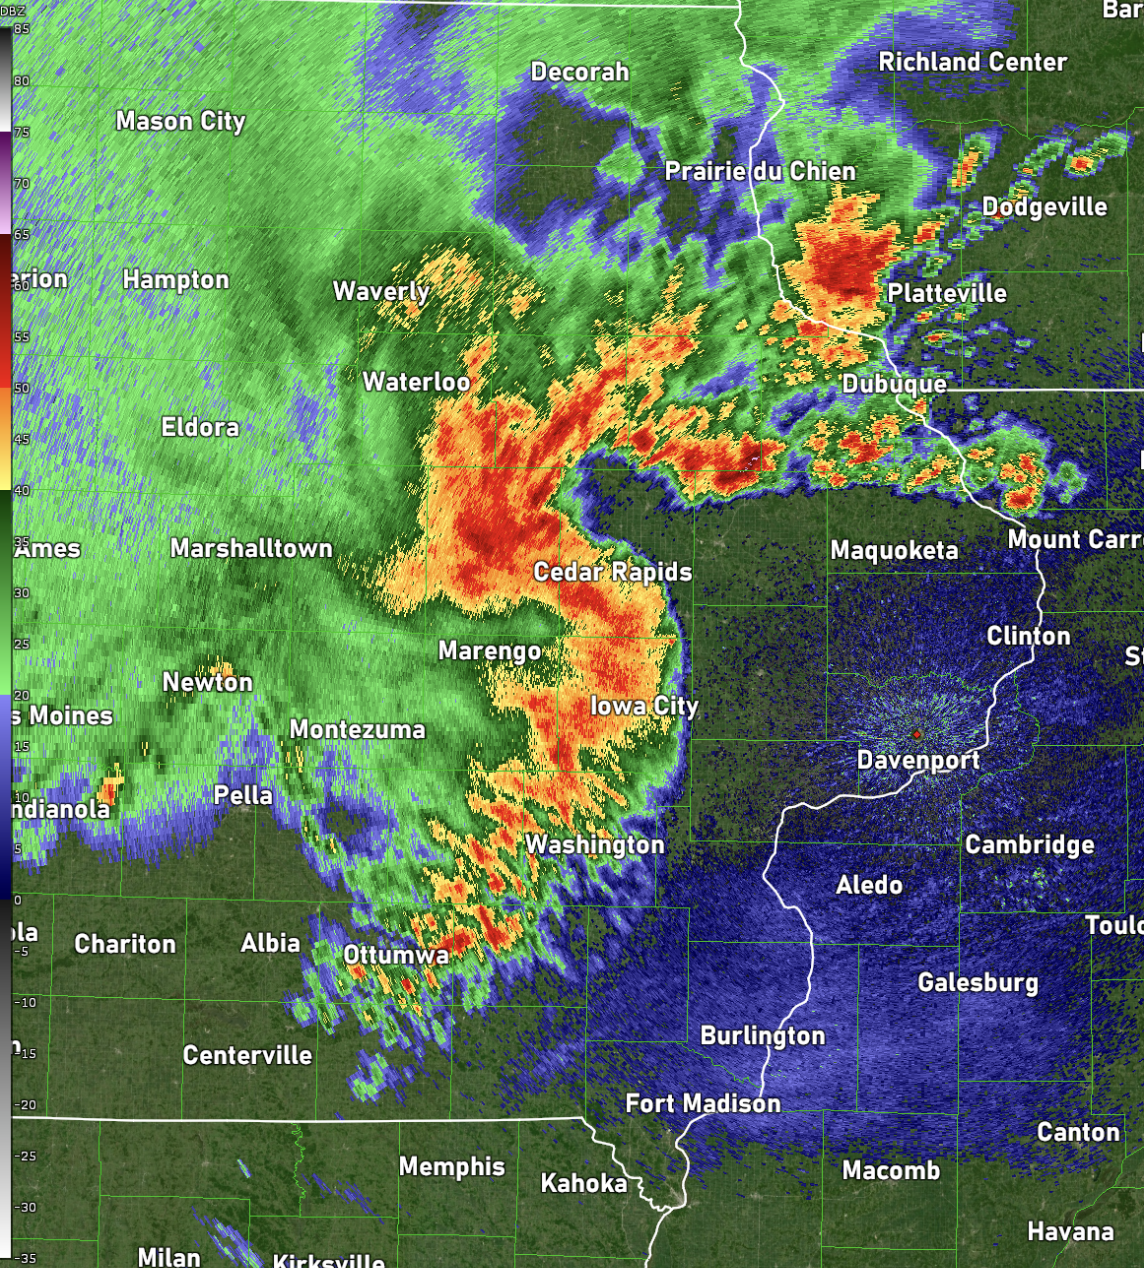
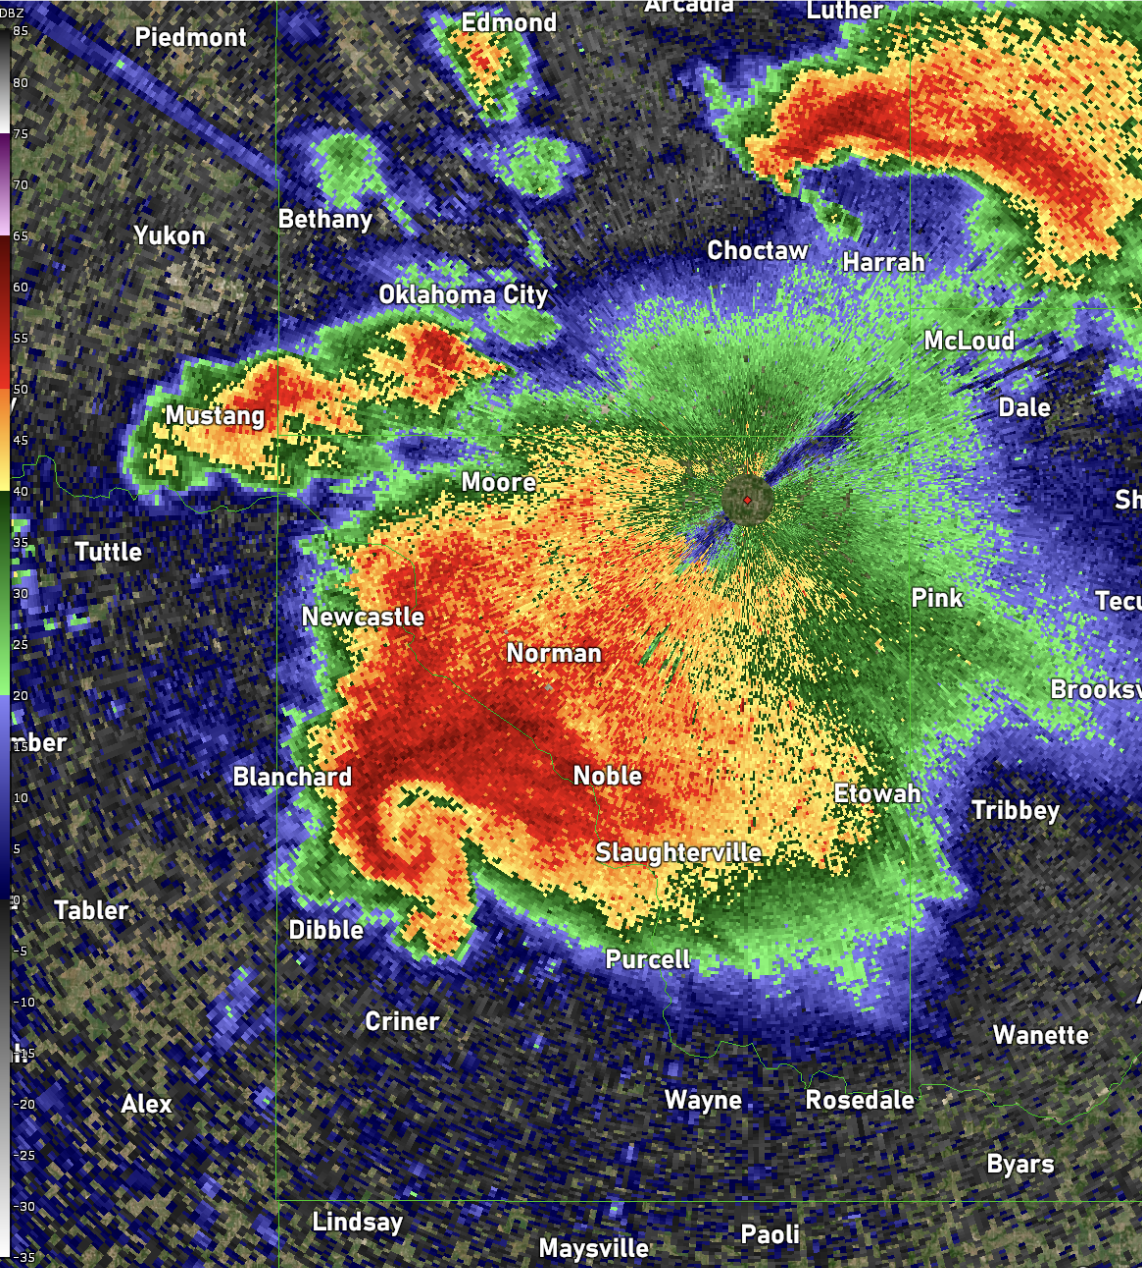
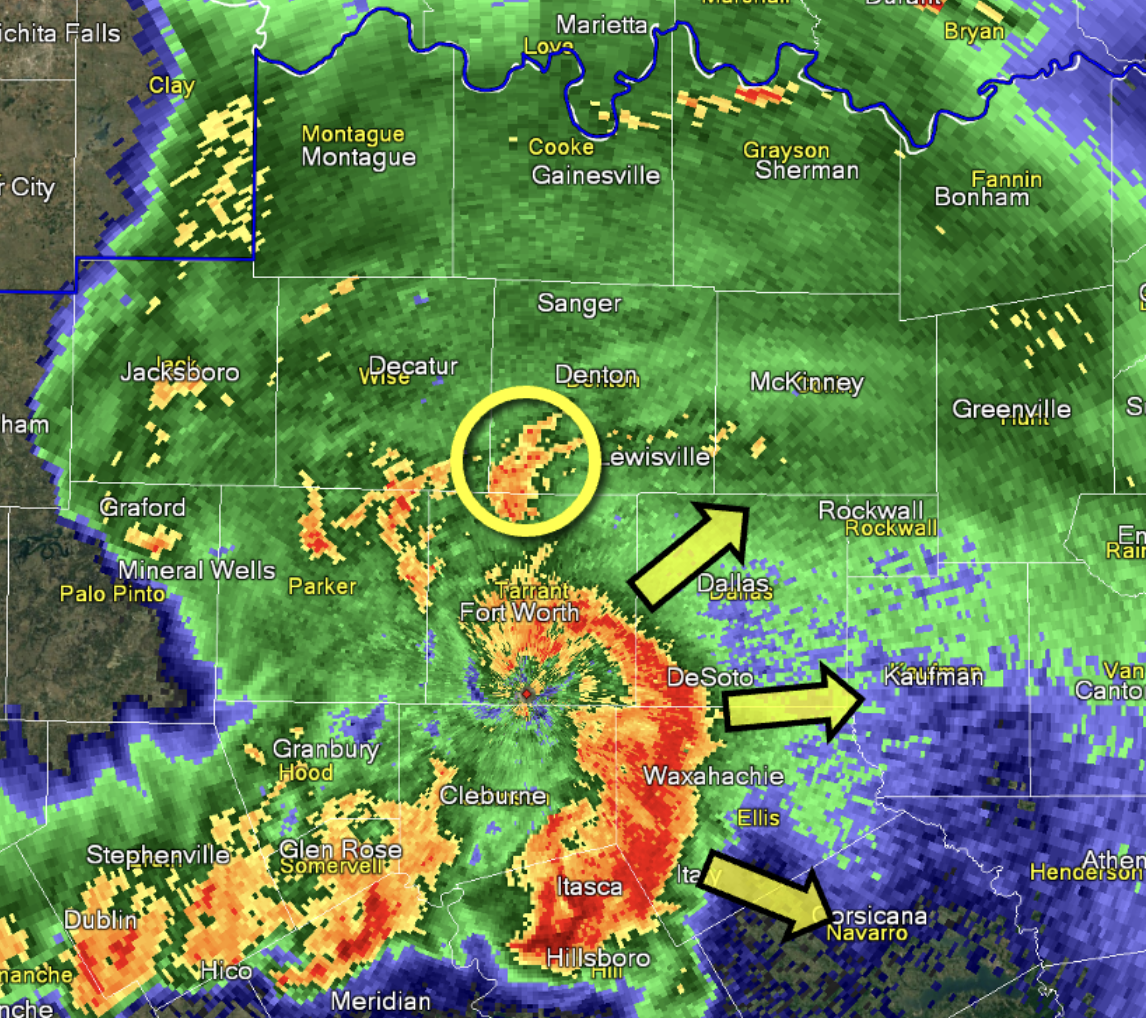
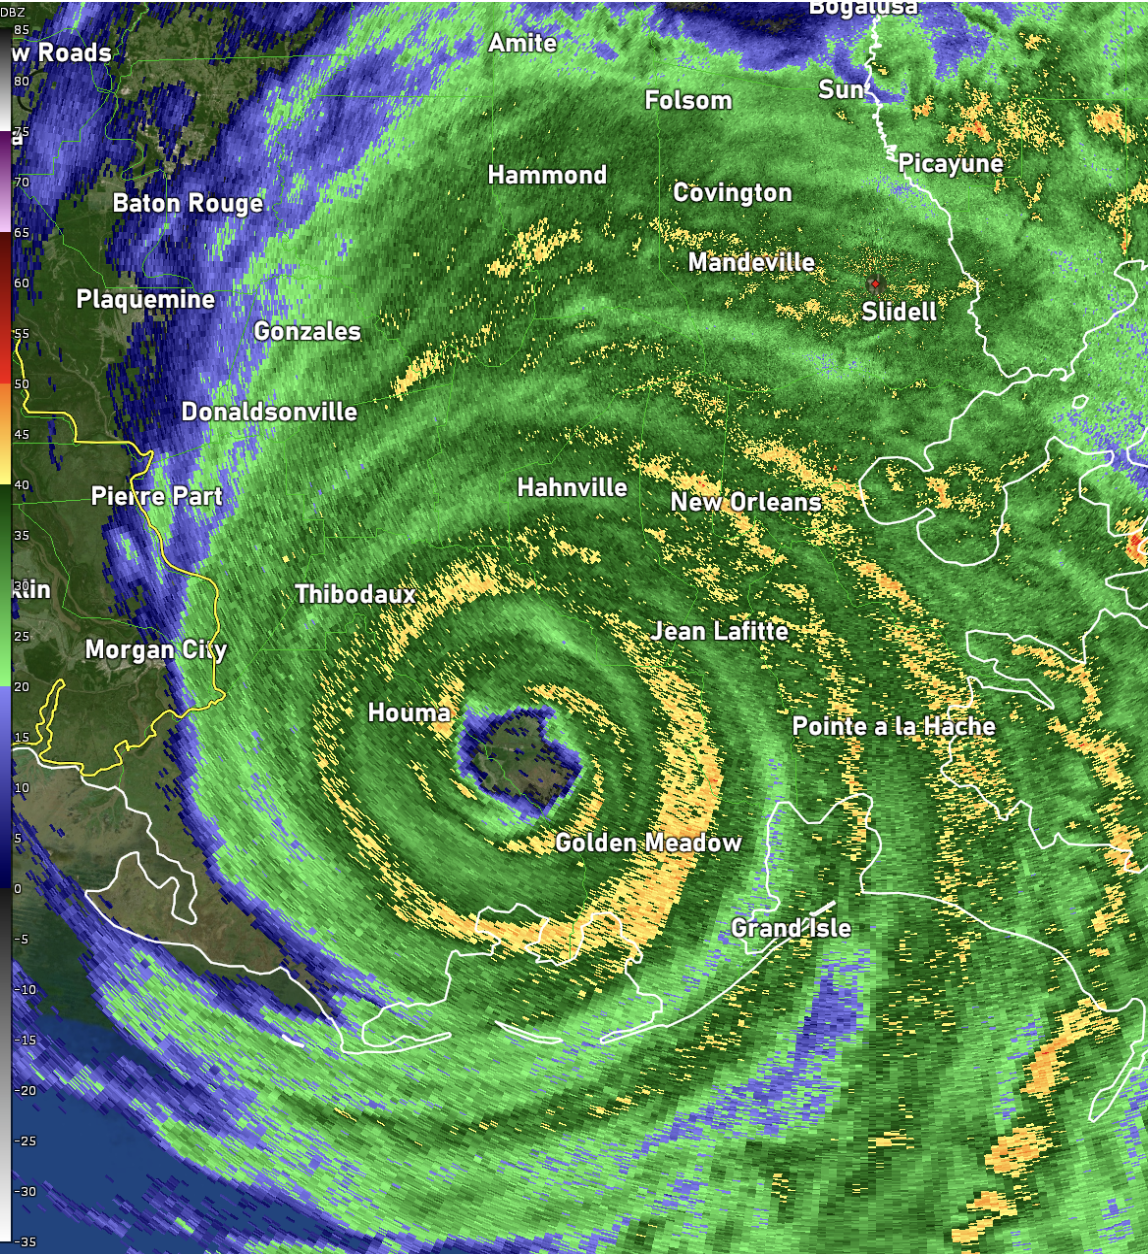
The reflectivity product will show where precipitation is occurring. Forecasters can see different storm attributes, such as hook echoes, bow echoes, and training echoes. All of these can be precursors to significant weather events. For example, a hook echo is a good indication that a storm has obtained rotation and is a common feature in severe supercell thunderstorms. Oftentimes, tornadoes that occur within supercells are located at the tip of the hook. Bow echoes are indicated by a bowing segment within the reflectivity pattern and can be an indication of damaging winds. Training echoes are when an area of precipitation develops and moves over the same areas with new thunderstorms tracking over areas that have already seen rainfall (training) and can be an indication of flash flooding potential.
How Does it Work?
Reflectivity is a measurement of returned power back to the radar, however this power return can vary significantly depending on the target that is hit. The WSR-88D transmits a pulse with 750,000 watts of power, but only receives a fraction of that power back to the receiver. In fact, the power return is so weak that it must be passed through amplifiers before the signal can be processed.
The units of reflectivity (denoted by the letter z), as derived from the radar equation, are in mm6 / m3. These units are difficult to work with, and the raw values of reflectivity vary greatly depending on the target. For example, tiny water droplets may have a raw reflectivity value of 0.001 mm6 / m3 while hail within a severe thunderstorm may have a raw reflectivity value of 36,000,000 mm6 / m3. This would be rather difficult for anyone to work with. So, the radar applies a logarithmic scale to significantly compress these values. Instead of working with difficult units, after the logarithmic scale is applied, we have units of decibels (dB) of reflectivity (Z) or dBZ. The scale runs from around -35 dBZ to +85 dBZ.

The Reflectivity Scale
Generally speaking, the higher the reflectivity, the heavier the precipitation. However, this is not always the case, and care must be taken not to discount lower reflectivity values in certain circumstances. As a general guideline, the following can be assumed:
|
|
|
||||||||||||||||
* See note about precipitation intensity below.
While the general reflectivity guidelines can be followed most of the time, there are some exceptions, especially when it comes to heavy rainfall. Remember that the radar does not directly measure rainfall intensity. It only measures the amount of power returned to the radar. Consider the example below:

In this example, both boxes are 1 cubic meter in volume. The box on the left contains 729 raindrops that are all 1 millimeter in diameter. The box on the right contains only 1 raindrop, but it is 3 millimeters in diameter. Since power return back to the radar is proportional to target drop size diameter raised to the 6th power, (remember those funky units - mm6 / m3), both of these boxes will return the same amount of power back to the radar. In both cases, the reflectivity is 29 dBZ, but the rainfall rate is considerably heavier (22 times heavier!) in the box on the left. Now, we all know that precipitation doesn’t fall in nice little boxes like this, but this example does illustrate how the drop size diameter does significantly impact the returned power to the radar. So, what does this look like in the real world?
(Left) Radar image of a bow echo that produced damaging winds near Ft. Worth, TX, in April 2012. The strong winds fan out in the direction of the arrows on the leading edge of the bow. To the north of this, a small unsuspecting blob of reflectivity (~40-50 dBZ) produced over 4 ½ inches of rain in 90 minutes despite having much lower reflectivity values compared to the bowing segment.
(Right) Hurricane Ida after making landfall in southeast Louisiana on August 29, 2021. Notice that reflectivity values are generally between 35-45 dBZ despite torrential rainfall and strong winds. This is because the raindrops associated with warm tropical systems are generally smaller than those in thunderstorms and contain little to no hail; therefore they return less power to the radar. Rainfall amounts between 10 and 15 inches fell across much of southeast Louisiana with this hurricane.
Base Reflectivity vs. Composite Reflectivity
Base reflectivity and composite reflectivity are the two most common types of images that you’ll see online, but each serves a different purpose and each has strengths and limitations.
Base Reflectivity is the reflectivity from the lowest elevation scan (0.5°) and is used primarily for weather detection across a large area. This is almost always the type of reflectivity that you’ll see on websites and television. Since it’s the first elevation of any volume scan, this image is available almost immediately after the radar is finished scanning.

Composite Reflectivity is produced at the end of the volume scan after the radar has completed all of its elevation angles. This is a composite product that takes the maximum reflectivity from each elevation angle and meshes it into one image. The advantage of this type of image is the ability to quickly assess the intensity of storms; however, the composite reflectivity product isn’t available until the end of the volume scan.
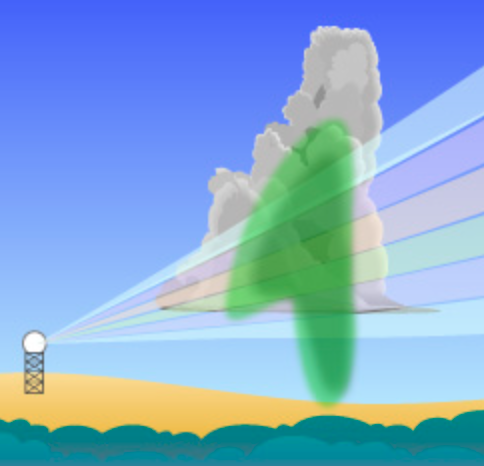
So when do I use Base Reflectivity and when do I use Composite Reflectivity?
Ideally, both of these images are used together to help obtain a clearer picture of what is occurring. As mentioned above, both base and composite reflectivity have strengths and weaknesses, and we’ll discuss those below:
|
Base Reflectivity |
|
|
Strengths |
Limitations |
|
Excellent for long range precipitation detection. |
Strongest part of the storm may not be sampled by lowest elevation. |
|
Can update as frequently as every 90 seconds depending on VCP configuration. |
Developing storms near the radar may go undetected. |
|
Can show important storm scale features such as hook echoes and outflow boundaries. |
|
|
Composite Reflectivity |
|
|
Strengths |
Limitations |
|
Storm intensity can be quickly assessed as the highest reflectivity is shown. |
Only produced after the radar has completed a volume scan (4-7 minutes) |
|
Developing storms near the radar are shown in the composite reflectivity. |
Storm scale features such as hook echoes and outflow boundaries are often masked. |
|
Excellent situational awareness tool to use during scattered summertime thunderstorms. |
|
Let’s take a look at the difference between Base Reflectivity and Composite Reflectivity with some real storms!
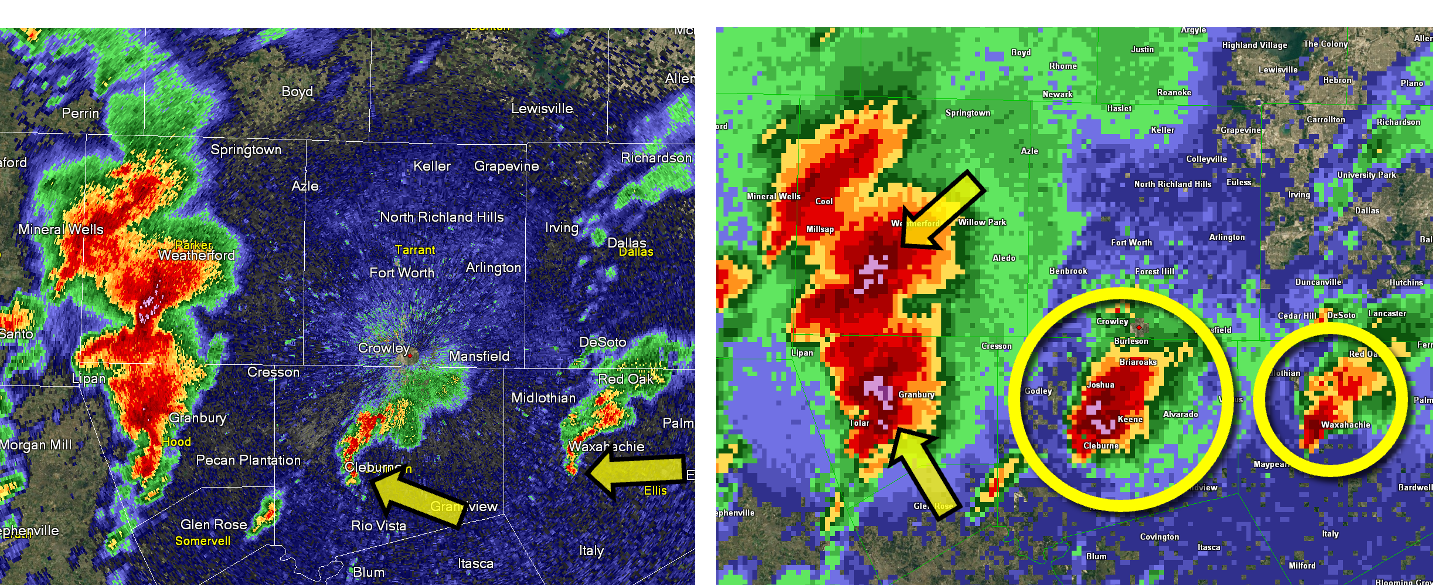
(Left): A cluster of severe thunderstorms approaches Fort Worth, TX, on April 3, 2012, as seen in the Base Reflectivity (0.5° elevation). Notice the two smaller storms (arrows) ahead of the main cluster. These storms have a small “hook” shape to their appearance.
(Right): Composite Reflectivity shows two intense cores within the main cluster of storms to the west. These storms produced severe hail and damaging winds. Farther east (circled storms), the composite reflectivity reveals that these storms are much stronger than indicated on the base reflectivity product, but the low level storm structure (hook shape) is masked. These storms would go on to produce a series of tornadoes in both Fort Worth and Dallas.
In the above images, some of the strengths and limitations of using both Base Reflectivity and Composite Reflectivity are evident. The strongest parts of the storms are easily identifiable in the composite imagery, while the low level storm structure is most evident in the Base Reflectivity. The east and northeast extent of lighter precipitation is also shown in the composite imagery. Let’s take a look at another example of classic summertime pop-up thunderstorms:

(Left): Base Reflectivity image of scattered afternoon thunderstorms across the Dallas-Fort Worth, Texas Metroplex. Notice how the reflectivity is generally low and unsuspecting in this image.
(Right): Composite Reflectivity image of the same group of scattered thunderstorms. Notice how much stronger these storms appear in the composite imagery compared to the base reflectivity image. The storms are still in the developing stage at this point and have very strong updrafts, so the core of highest reflectivity is well above the 0.5° elevation angle. This is important, because summertime thunderstorms are often slow moving and develop very quickly, then collapse, sending out strong outflow winds. These storms produced isolated damaging winds as they collapsed about 15 minutes later.
Fast Facts
The dBZ values equate to approximate rainfall rates indicated below.
| dBZ | Rain Rate (in/hr) |
Rain Rate (mm/hr) |
|---|---|---|
| 65 | 16+ | 420+ |
| 60 | 8.00 | 205 |
| 55 | 4.00 | 100 |
| 50 | 1.90 | 47 |
| 45 | 0.92 | 24 |
| 40 | 0.45 | 12 |
| 35 | 0.22 | 6 |
| 30 | 0.10 | 3 |
| 25 | 0.05 | 1 |
| 20 | 0.01 | Trace |
| < 15 | No rain | No rain |
These are hourly rainfall rates only and are not the actual amounts of rain a location receives. The total amount of rain received varies with intensity changes in a storm as well as the storm's motion over the ground.


