
The mission of the River Forecast Centers is to provide actionable, Impact-based Decision Support Services to regional stakeholders related to regional hydroclimatology for the nation's environmental and economic well-being.

Hydrology is the science of water on Earth – where it occurs and how it circulates through the hydrologic cycle as precipitation, runoff, evaporation, and groundwater.
River Forecast Centers (RFC) are National Weather Service offices that serve groups of Weather Forecast Offices by providing river and flood forecasts and warnings as well as basic hydrologic information. Some responsibilities are seasonal or as-needed, including water supply forecasts, flood outlooks, and drought summaries.
Staff from many different science backgrounds fill RFC forecasting positions of the hydrologic forecaster and hydrometeorological analysis and support (HAS) forecaster. The hydrologic forecast looks at how water and soil interact and how fast the river water flows downstream, called the routing. The hydrologic forecaster is the person who creates the daily river forecasts, flash flood guidance, data summaries, and river forecast computer models. The HAS forecaster prepares the observed and forecast rain/snow and temperature data needed to put into the river forecast model, called the Graphicast. They also support the hydrologic forecaster and the NWS Forecast Offices.
Precipitation Forecasting
Forecasting rivers begins with the rainfall and snowfall forecast. RFC hydrometeorologists and hydrologists prepare precipitation forecasts for multiple days at a time to monitor developing weather systems.
Precipitation Analysis
Multiple organizations and offices maintain gage stations – sites on a river, stream, canal, or other body of water where observations of water level (stage) and flow are measured.
RFC staff hydrometeorologists and hydrologists look at Doppler radar plus rainfall and snowfall measured from the local, state, and federal gage networks to estimate actual rainfall over a region. This information is used in the RFC hydrologic and hydraulic models of how precipitation and runoff flow and how that interacts with the soil and other land features. Observations from the National Weather Service (NWS) Cooperative Observer Program (COOP) observations and the Community Collaborative Rain, Hail, and Snow Network (CoCoRaHS) are also used in this analysis.
This estimated precipitation combined with the forecasted time period allows hydrologists to model how much and when water is expected to reach a river or stream.
River Flow Modeling
To be able to forecast the amount of water flowing through a certain point along a river, the forecaster breaks the flow down into three components:
- Baseflow: the amount of water coming from groundwater.
- Runoff: the amount of water flowing over the surface of the land.
- Routed Flow: the amount of water coming from an upstream point in the river.
Baseflow
Baseflow, the water coming from groundwater, is never constant. It increases immediately after rainfall, then falls again until the next rainfall.
Runoff
Runoff comes from two sources, rainfall and snowmelt. A forecaster can estimate the amount of runoff for each location based on certain details about the weather and the land around the river, called the river basin. Snowmelt is calculated based on the air temperature and the amount of sunshine. Rainfall runoff is estimated based on the slope of the land, the amount of paved ground and buildings, the types of soil, the amount of the last rainfall, the time since the last rainfall, and the amount of evaporation occurring over the basin.
When rain begins to fall, the runoff does not immediately go into the river; the amount of time it takes depends on where in the basin the rain fell.
To get a sense of how this works, envision a parking lot with a storm drain at one end. Think of what happens if a steady, even rain falls over the entire parking lot. The rain water doesn't reach the drain all at once because the rain fell at different distances from the drain and needs to travel to it. Even when the rain stops, water will continue to flow into the drain until the water from the farthest part of the parking lot reaches the drain. If the amount of water going through that drain was recorded and put on a graph of water flow versus time, it would look something like this:

Any graph of water flow versus time is called a hydrograph. When a forecast is being made, the forecaster always uses a hydrograph of the stream at the forecast point. From this hydrograph, the forecaster can begin to make a forecast.
A special hydrograph, called the unit hydrograph, is used by forecasters when they want to know how much water will be put into the stream by runoff. The unit hydrograph is based on the basin receiving enough rain to make one inch of runoff. An inch of runoff is the equivalent to having the entire basin of a particular stream or river covered in an inch of rain that does not infiltrate (soak) into the ground. The unit hydrograph shows how much of this inch of runoff will go into the stream in a specific amount of time. For the unit hydrograph to work properly, the length of time in which the runoff was generated and the time intervals on the unit hydrograph must be the same.
A river forecast model adds each of the three flow components mentioned above for every forecast period and converts the total flow to a stage forecast. Six different rainfall-runoff models and three routing methods are widely used by NWS RFCs.
Soil Water Modeling
Several River Forecast Centers use the Sacramento Soil Moisture Accounting (SAC-SMA) rainfall-runoff model. The SAC-SMA is a model that calculates total amount of runoff based on the different types of soils in the area, called soil zones, which absorb water differently. Many different pieces of information are used to show the movement of water into and out of these zones. The model also stores information about the amount of moisture in the soil in order to estimate the amount of runoff when it rains in the future.
A unit hydrograph is used to figure out local water flow based on the runoff calculated from the Sacramento model. The local flow is added to routed flows (the water already in the river) at each gage site to figure out the total flow for each forecast. Total flow is then described as a stage (water level/height) forecast based on the relationship between stage and flow at each specific gage site.
Heavy rainfall will affect any portion of the river, but the most sensitive areas during or immediately following rainfall are the small streams, tributaries, and headwaters that flow into the mainstem rivers. These areas can very quickly have hazardous flash flooding. However, these flows can recede just as quickly as they rose, creating short-term flooding conditions.
Mainstem River Forecasting

Modeling river flow involves many pieces that must work together to create an accurate forecast. One factor, soil moisture, is modeled to estimate how much of the rainfall will actually become runoff rather than remain in the soil. A second factor is lag, the time it takes for the runoff to reach gage A, the first gage in a network. A third factor is attenuation, which is how the wave of water spreads out as it flows downstream. Channel losses – water that infiltrates into the bed of the river – can also be modeled if appropriate for the local hydrology.
Once the lag and attenuation are determined for various flowrates and stages, the water is routed to the next gage (gage B) downstream. This flow then combines with the local runoff between gage A and B to create the forecast for gage B. This process continues all the way downstream (e.g., A to B, B to C, C to D, etc.).
Water released from reservoirs by the Corps of Engineers, the Bureau of Reclamation, river authorities, and water districts are also coordinated and included in all forecasts. Additionally, the U.S. Geological Survey (USGS) and other agencies provide accurate flow and stage observations during flood events for use with the forecasts.
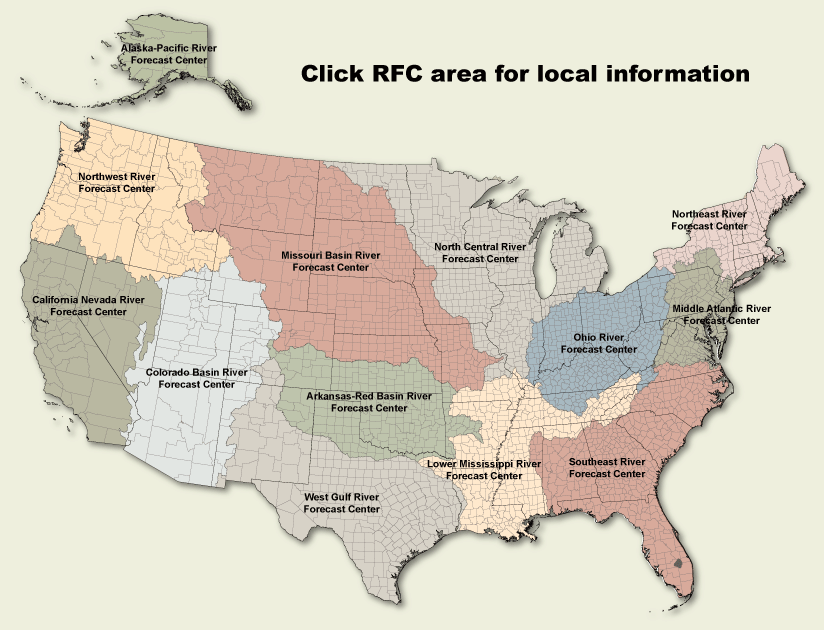
Below is a map of the river forecast centers and their areas of responsibility. Click or select on image below or use the drop down menu to go to any office.
The RFC provides hydrologic guidance for time scales that vary from hours (flash flood guidance and support to Local Flood Warning Systems) to days (traditional flood forecasts) to weeks (snowmelt forecasts), to months (seasonal water supply), as seen in the figure below.

The RFCs are firmly committed to providing the best possible river forecast guidance. Improvements come in the form of expanded coverage and increased quality. Efforts are continuously underway to improve the process used to forecast flooding, spring snowmelt, and water supply volumes.