

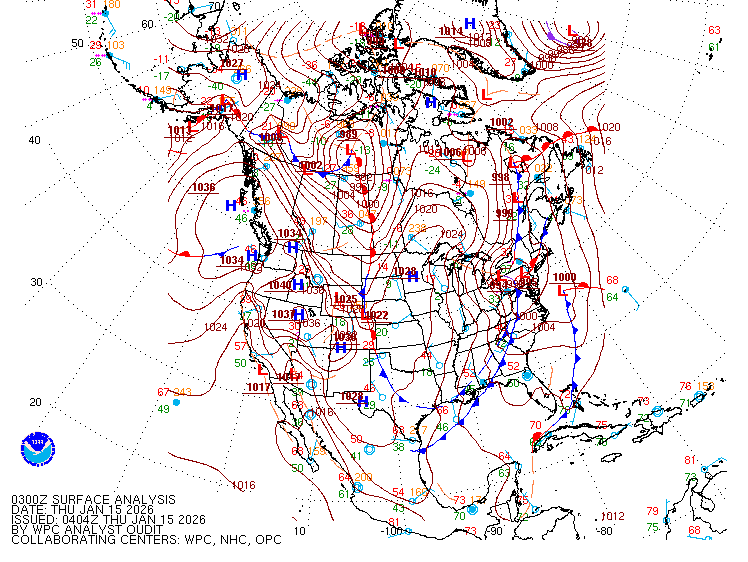
Some surface maps show station weather plots – a collection of symbols depicting the weather occurring at a weather observing station at a specific time. These plots allow meteorologists to convey a lot of information in a small space without using a lot of words.
A large number of weather symbols are used for station plotting. Some express weather elements such as rain, snow, and lightning. Others represent the speed of the wind, types of clouds, air temperature, and air pressure. When all stations are plotted on a map, a "picture" is created that indicates where the fronts, high- and low-pressure areas are located.
This sample plot expresses the maximum amount of information about the current weather at an observing station; hand-plotted maps usually contain the full weather information. However, nowadays, it is rare to see the full plot as most computer-generated surface weather maps omit some data such as clouds types, cloud heights, and past weather.
Before computers, the plotting of weather maps was considered an art. In fact, Aerographer’s Mates (“weathermen”) in the U.S. Navy continue to plot maps by hand. A skilled plotter can easily fit the above information under the space covered by a dime.
Decoding these plots is easier than it may seem. The values are arranged similar to a tic-tac-toe grid. Print key (pdf)

|
In the upper left corner, the temperature is plotted in Fahrenheit. In this example, the temperature is 77°F. |

|
Down the center column, the cloud types are indicated. These cloud types use the same cloud codes as found in the Cloud Chart Section. The top symbol is the high-level cloud type above the mid-level cloud type. The lowest symbol represents the low-level cloud above a number indicating the height of the base of that cloud (in hundreds of feet). In this example, the high-level cloud is cirrus, the mid-level cloud is altocumulus, and the low-level cloud is a cumulonimbus with a base height of 2000 feet. [more on these symbols] |

|
At the upper right is the atmospheric pressure expressed as mean sea level in millibars (mb), rounded to the nearest tenth, with the decimal point and leading 9 or 10 omitted. In this case, the number “998” indicates that the pressure would be 999.8 mb. If the pressure was plotted as 024, it would be 1002.4 mb. When trying to determine whether to add a 9 or 10, use the number that will give you a value closest to 1000 mb. |

|
On the second row, the far-left number is the visibility in miles. In this example, the visibility is 5 miles. |

|
Next to the visibility is the present weather symbol. There are 95 symbols for representing weather that is either presently occurring or has ended within the previous hour. In this example, a light rain shower is occurring at the time of the observation. [See all the symbols] |

|
The circle symbol in the center represents the amount of total cloud cover, reported in eighths. This cloud cover includes all low, middle, and high-level clouds. In this example, 7/8th of the sky is covered with clouds. [See the complete list of symbols] |

|
The number and symbol in the center right field of the grid tell how much the pressure has changed (in tenths of millibars), and the trend of that change, in the past three hours. In this example, the pressure was steady, then fell (lowered), becoming 0.3 millibars lower than it was three hours ago. [See all pressure tendency symbols] |

|
The number in the lower left corner is the dew point temperature. The dew point temperature is the temperature the air would have to cool to become saturated, or, in other words, reach a relative humidity of 100%. In this example, it is 71°F. |

|
The lower right area is reserved for the past weather, which is the most significant weather that has occurred within the past six hours, excluding the most recent hour. [See the all the past weather symbols] |

|
These lines, extending from the sky cover plot in the center and superimposed over the grid, indicate wind direction and speed rounded to the nearest 5 knots. The longest line points in the direction that the wind is blowing from. Thus, in this case, the wind is blowing from the southwest. The shorter lines, called barbs, indicate the wind speed in knots (kt). Each long barb represents 10 kt, while each short barb represents 5 kt. In this example, the station plot contains two long barbs, so the wind speed is 20 kt, or about 24 mph. [More about wind barbs] |
Analyzing Weather Maps
Once you can read a station plot, you can begin to perform map analyses. Meteorologists use the station plots to draw lines of constant pressure (isobars), temperature (isotherms), and dew point (isodrosotherms) to achieve an understanding of the current state of the atmosphere. This knowledge ultimately leads to better weather forecasts and warnings.
Learning Lesson: Drawing Conclusions