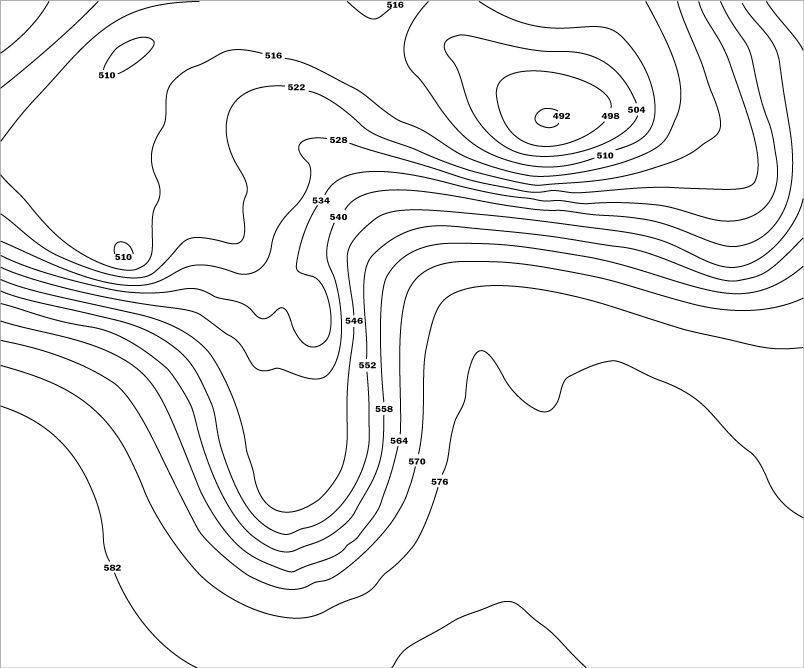
Height Contours
The 500 millibar constant pressure charts is the mainstay of the upper air charts. If meteorologists could only look at one chart, the 500 mb level chart would, by far, be the top choice.
Ranging in elevation from 16,000 feet (4,980 meters) to nearly 20,000 feet (6,000 meters), this is considered the "middle" of the atmosphere. It is based upon the assumption 500 mb is one-half of 1000 millibars (at sea level) and the top of the atmosphere, zero millibars, which occurs at 30+ miles (50+ kilometers) high.
For the 500 mb level constant pressure chart heights, the last digit, 0 (zero), is omitted from the chart. Adding a zero to the end of the four-digit height value reveals the actual height in meters. For example, a height value of "564" means the actual height is 5,640 meters (18,503 feet).
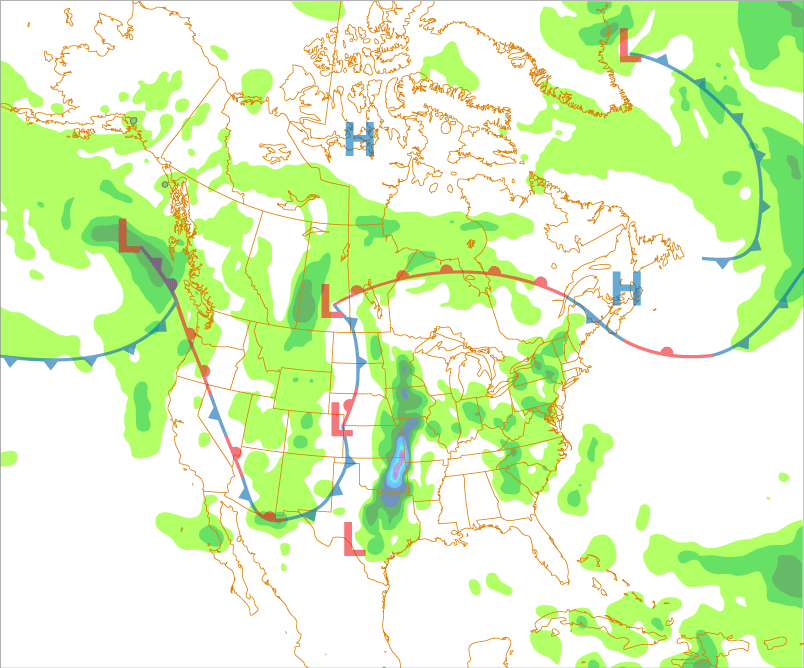
Vorticity
This chart provides a measure of the "spin" in the atmosphere called vorticity. Vorticity is simply the rotation of a fluid (in meteorology, the rotation of air) which can be in any three-dimensional direction. In synoptic meteorology, our concern is rotation with its axis perpendicular to the Earth's surface.
On the 500 mb chart, the vorticity identified is called "absolute vorticity". This is a combination of shear vorticity and rotation vorticity that determine the total spin at any location.
Take it to the MAX! The "Spin" Zone - Absolute Vorticity
The units for vorticity, 10-5/sec, refers to the number of rotations per second. On the 500 mb constant pressure chart, the vorticity values are whole numbers, with the 10-5/sec. omitted.
For example, an absolute vorticity value of 16 x 10-5/sec. will simply be seen as "16" on the chart. The higher the vorticity number, the faster the rotation. These "vorticity maximums" also help us locate the shortwave troughs that are embedded within the longwaves in the atmosphere.
However, as was stated in the introduction to the constant pressure charts, the value of vorticity is not as important as is the rate of change by which vorticity increases or decreases.
Downstream from (ahead of) areas of maximum vorticity are the locations of the greatest rate of increase in vorticity. This implies an area where air converges at the low levels and, therefore, rises into the atmosphere, possibly leading to precipitation. Conversely, upstream from (behind) areas of vorticity maximum are where greatest rates of decrease in vorticity are located and are where air sinks and diverges (in the lower levels), leading to fair or improving weather.
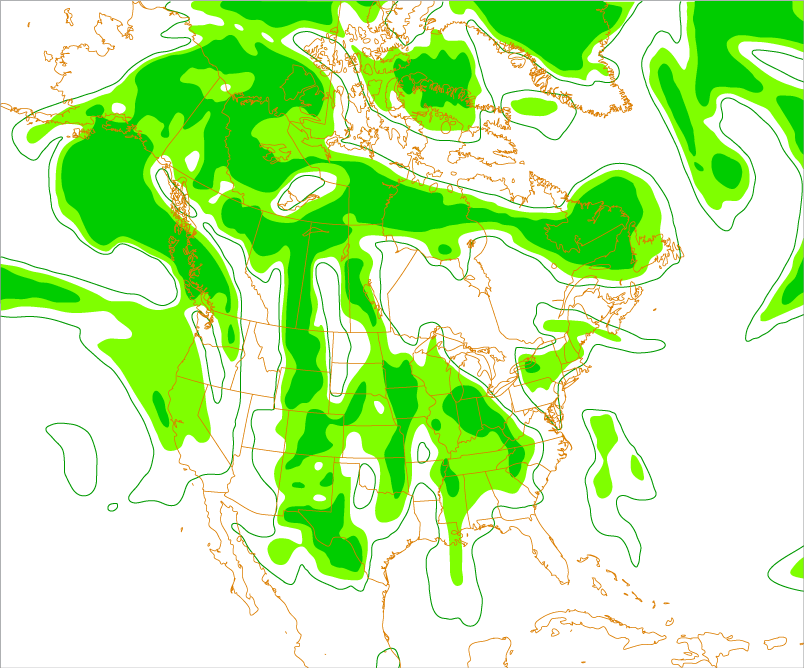
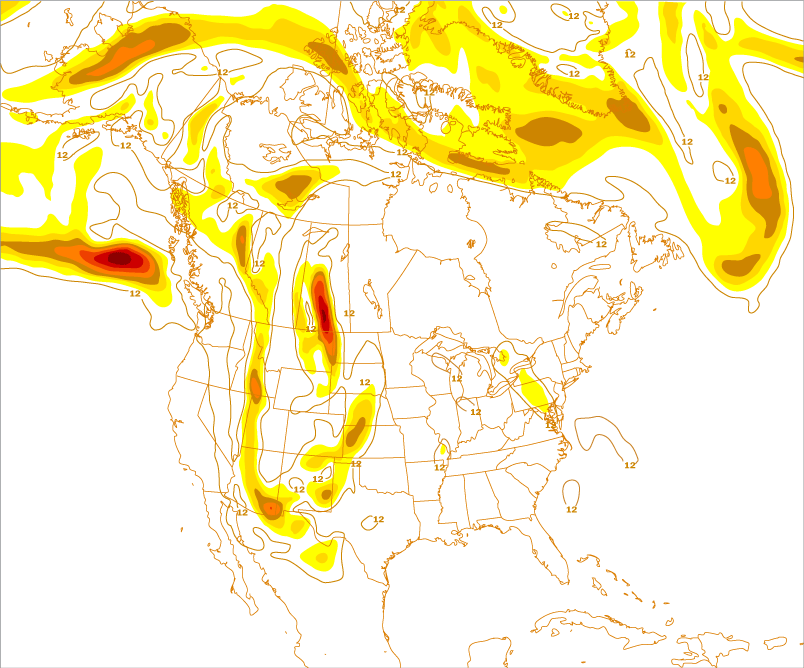
Humidity
Besides vorticity, moisture is important to help determine where precipitation will or will not occur. The 500 mb level chart looks at the amount of moisture in the atmosphere by displaying relative humidity.
In the example below, the contours are 50% relative humidity (line), 70% relative humidity (light green shading), and 90% relative humidity (dark green shading). However, remember this is only at the 500 mb level. There may be more or less moisture at other levels.